


Data is not numbers on a screen or files in a server room. For people, it has always meant the raw inputs of life — harvests tallied, rumors gathered, stars charted, neighbors counted. Driven by the need to impose order on the world, humans turned perception into concepts that both described and reshaped reality. What mattered were the tools and rituals that turned fragments into patterns, and patterns into action.
Civilization itself can be read as a system of data processing: cities grew from managed grain, cultures from stored knowledge, empires from censuses, democracies from tallies, industries from punch cards. Seen this way, computing isn’t a rupture but a continuation — the latest expression of our urge to turn information into judgment, structure, and power.
Each machine and theory marks a stage in this history, a crystallized moment of cultural logic that made the modern world possible.
The Pre-History of Programmable Hardware
Many processes we now consider to be data processing also exist in nature. The ability to sense, measure, and store information is found in many life forms, allowing them to detect food, danger, and other external stimuli.
Humans started counting tens of thousands of years ago. Several notched bones, dated to 30,000-40,000 BCE, evidence this practice. These tools are thought to have helped our ancestors count things like lunar cycles. The ability to count repetitive events and the attempt to simplify this process were key factors in building and advancing society, as they formed a foundation for trade, navigation, resource management, and communication between individuals and groups.
Whether through piles of sticks, knots on threads, stones on wires, cogs and levers, punched cards, vacuum tubes and circuits, or disks and clouds, humankind has always been in search of ways to extend its capacity for storing and processing information. This search has one primary approach: automation, which involves deconstructing a process and outsourcing its elements to external tools.
A01_AUTOMATA_CONTROL
Early Automation — Temple Miracles [Tower Clocks] and Music Boxes
Before punch cards and programmable computation, humans engineered astonishing mechanical systems to represent, control, and display data. These devices served as precursors to modern information technologies, blending automation with symbolic function.
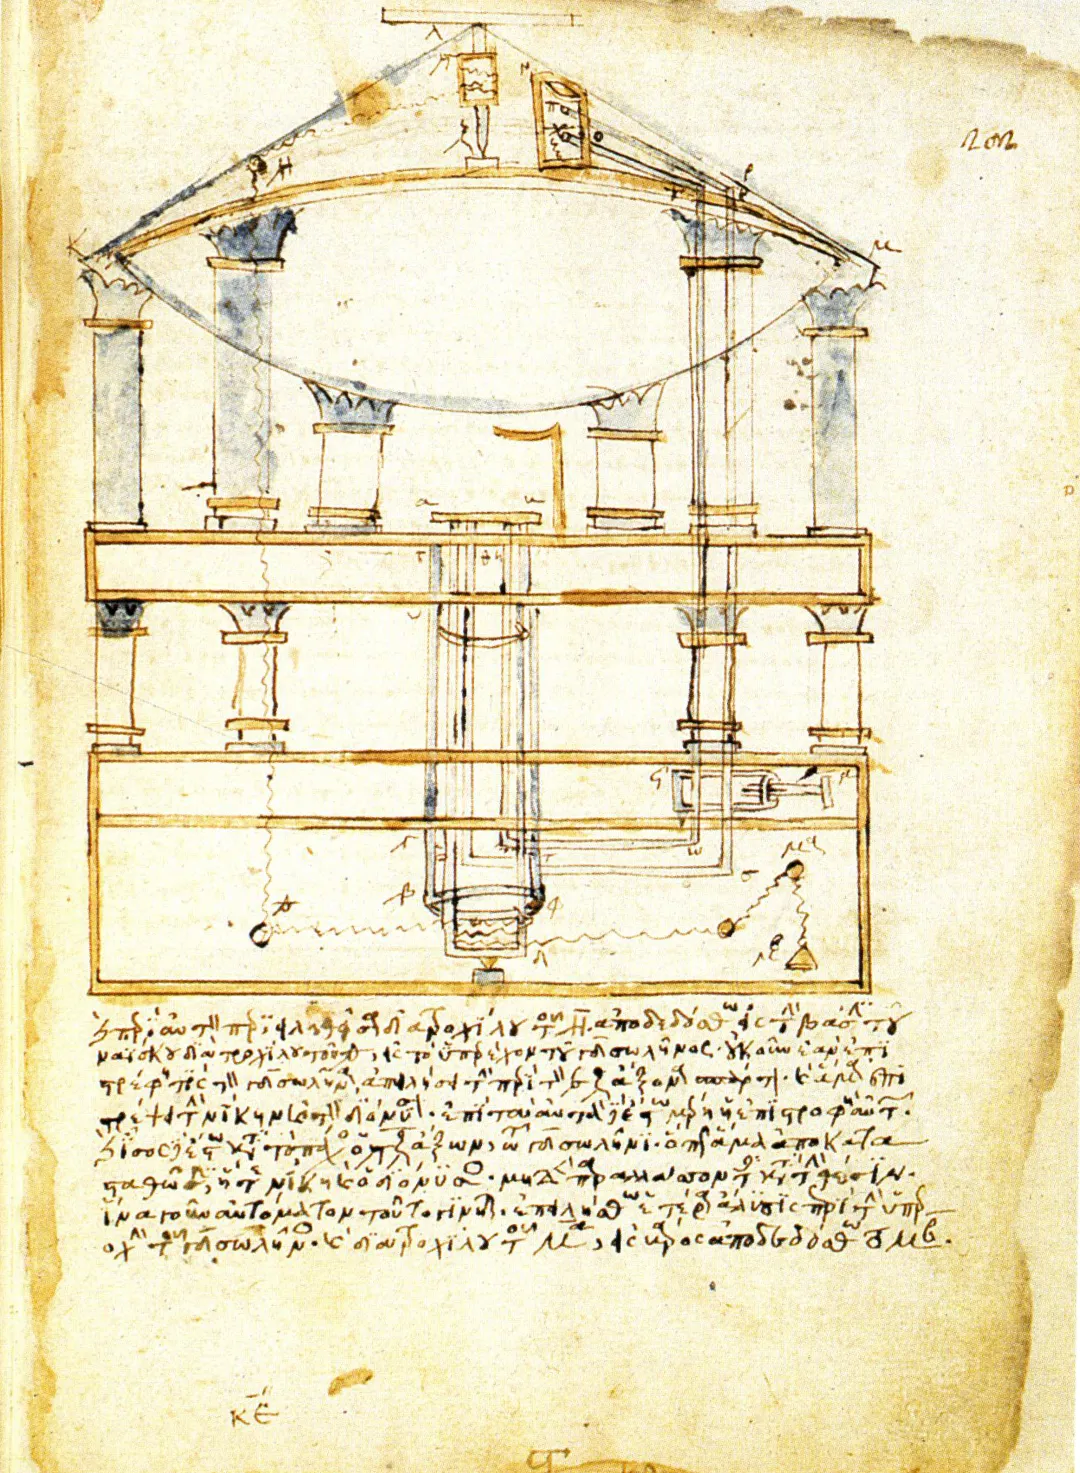
Heron’s automation project for a statue of Bacchus pouring wine and milk in a temple. Illustration in a 13th century manuscript. Source
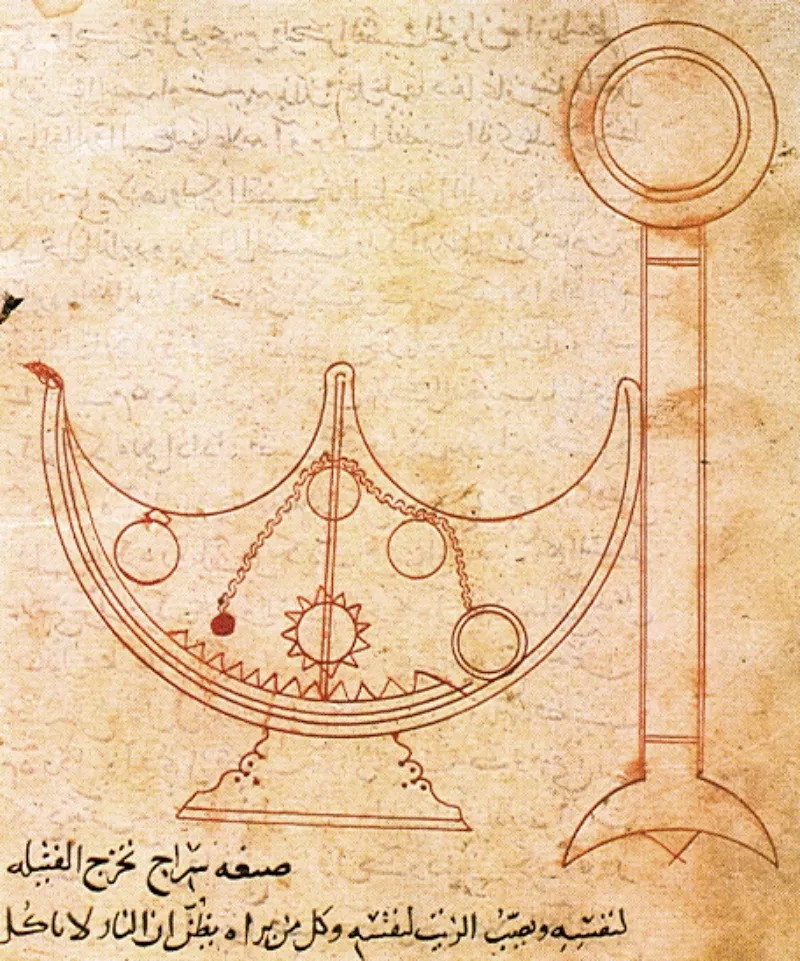
A self-trimming lamp, from the book “On Mechanical Devices” by Ahmad ibn Mūsā ibn Shākir (9th century CE). Source: Staats Bibliothek Berlin
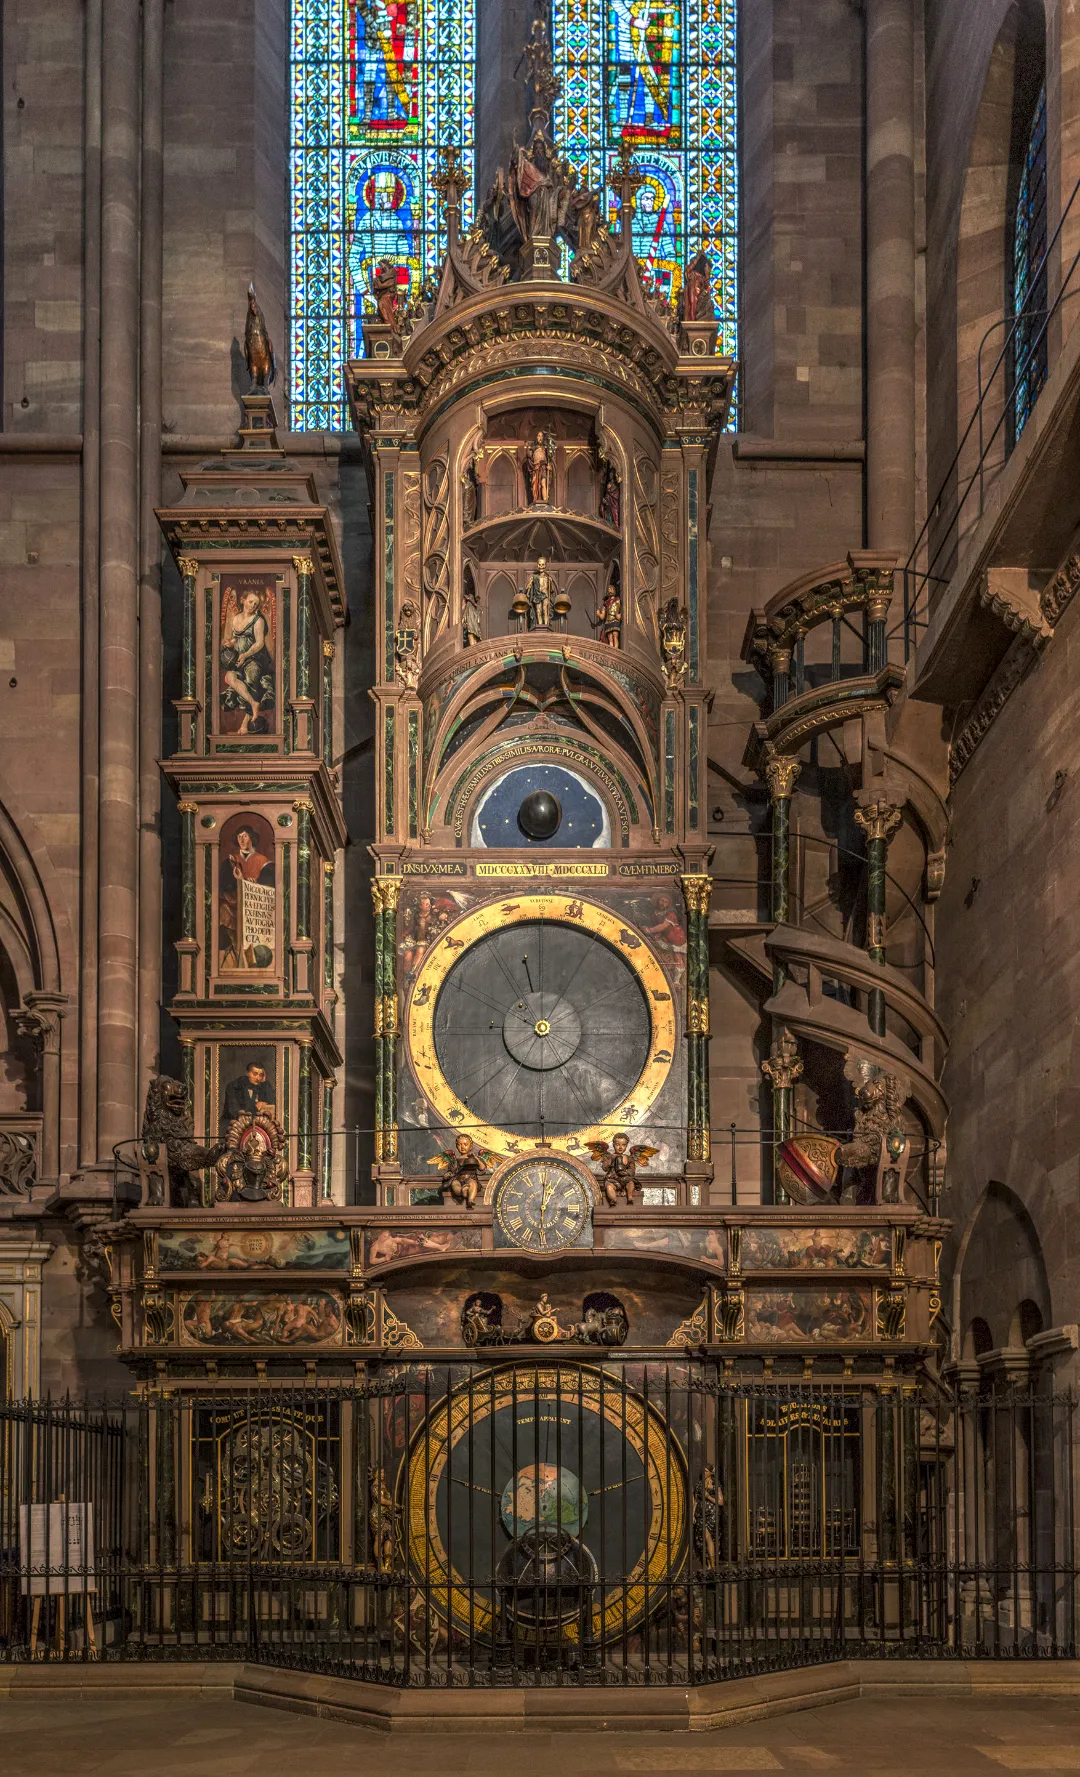
Strasbourg astronomical clock (1574), a civic monument of timekeeping and automata. Source
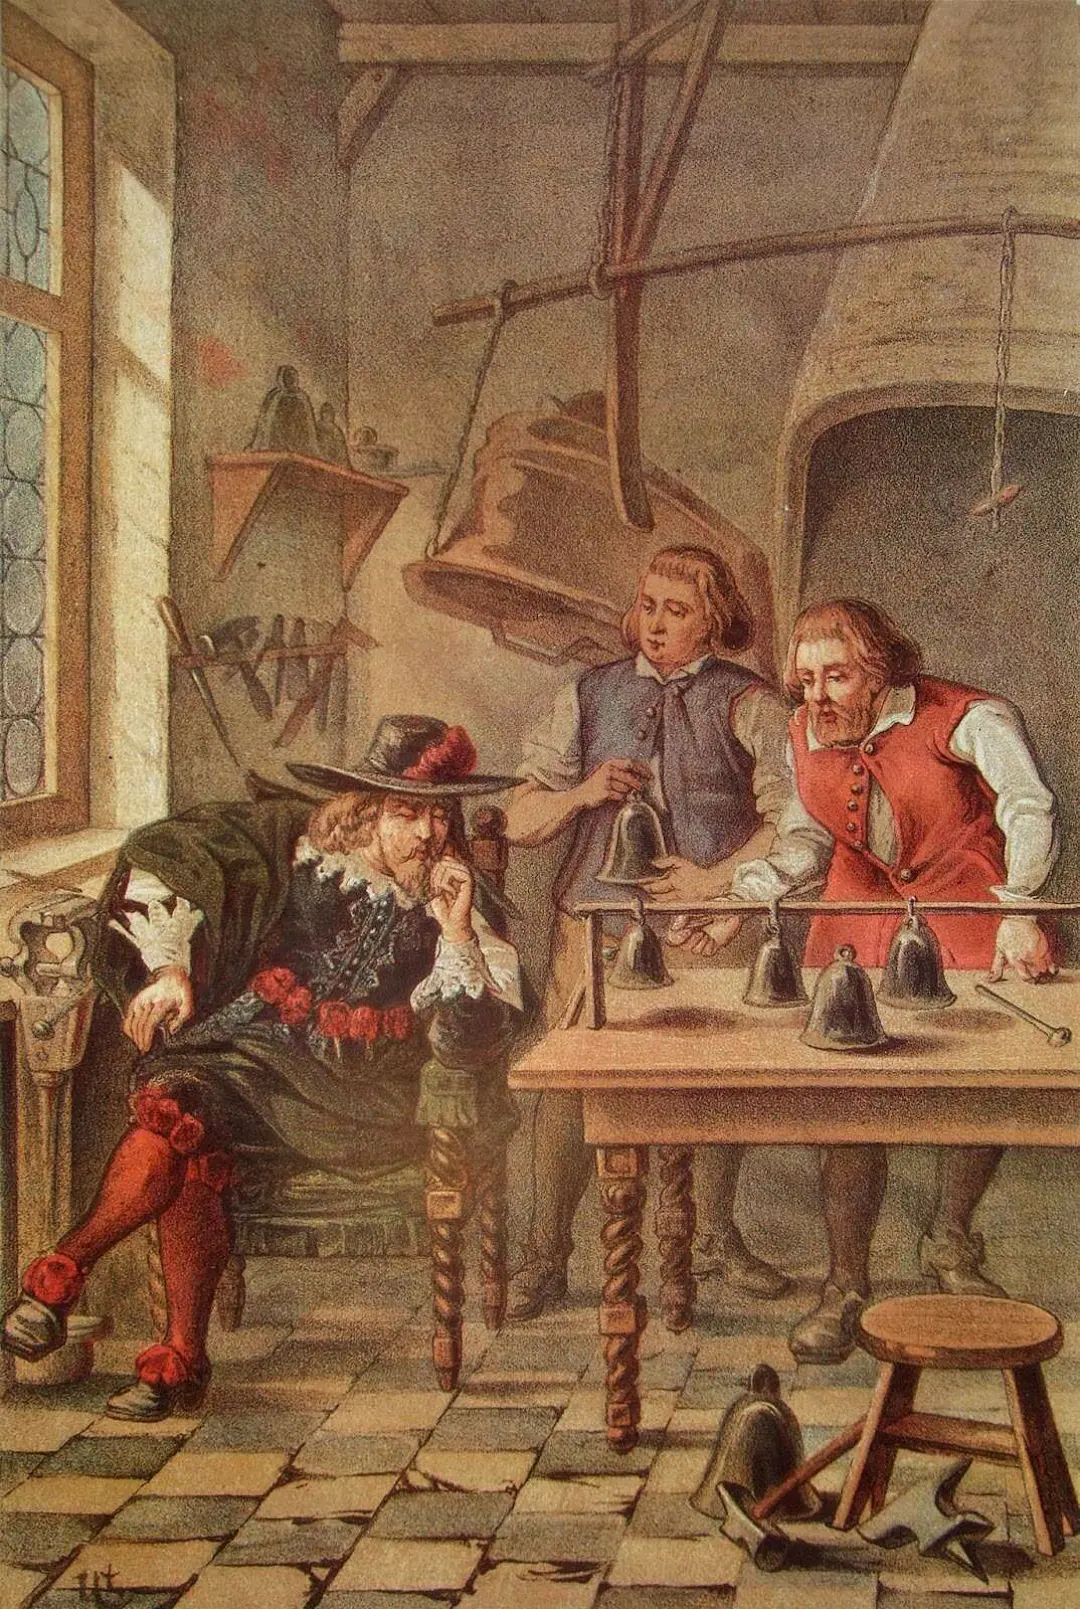
Van Eyck and the Hemony brothers working on the carillon. Lithograph by W. G. Hofdijk (c. 1875), from “Lauwerbladen uit Neerlands Gloriekrans. Source
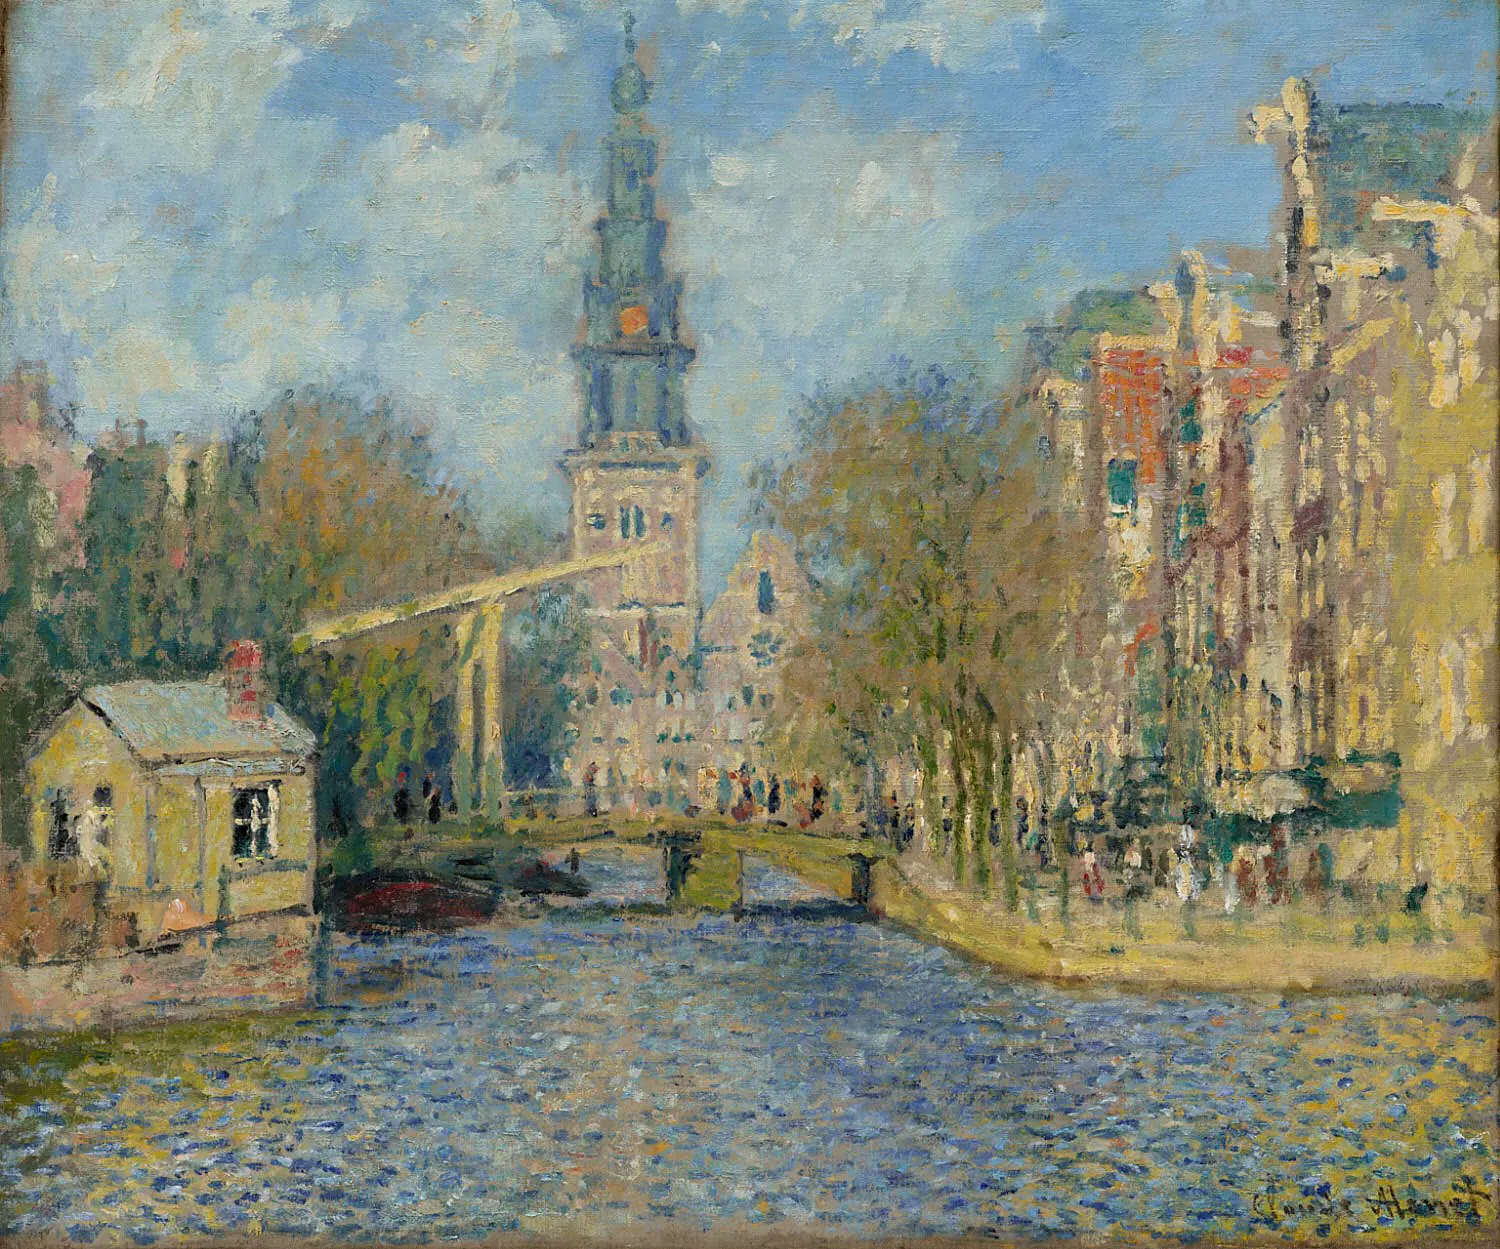
Claude Monet, “The Zuiderkerk, Amsterdam” (c. 1874). Philadelphia Museum of Art. The Zuiderkerk tower (1656) was among the earliest to house a fully automated Hemony carillon — a direct antecedent to punched media. Source
One of the earliest documented examples is Heron of Alexandria’s 1st-century CE automata: programmable theater devices, coin-operated dispensers, and wind-powered machines. These relied on systems of ropes, gears, and counterweights — physical logic encoded in motion. They demonstrated that information could be embedded in a mechanism, with repeatable outputs triggered by controlled inputs.
By the late Middle Ages and early modern period, public clocks and automata took on increasingly representational functions. The Strasbourg astronomical clock, for instance, combined religious calendar tracking with celestial mechanics, animating saints, angels, and planetary positions. These weren't mere decorations — they automated civic rituals and encoded cosmic models for public audiences.
In the 17th century, the Hemony brothers pioneered pinned-cylinder bell carillons in Amsterdam, prefiguring later musical machines and punch card systems. Their programmable melodies translated sound into hardware logic — a principle reused in music boxes, player pianos, and eventually looms and computers.
 A01_AUTOMATA_CONTROL
A11_JACQUARD_BINARY
Automata and cathedral clocks show that processing began as spectacle. These devices staged order in public, encoding rules in gears and rituals. They remind us that before computation was practical, it was performative — a demonstration of control over time, matter, and imagination. The next leap took this spectacle of control and turned it into infrastructure: the Jacquard loom.
A11_JACQUARD_BINARY

Jacquard Loom — A Mechanism of Memory and Control
In 1725, Basile Bouchon, a textile worker from Lyon, adapted techniques from pinned music automata to control weaving with perforated paper tape. It was a subtle revolution: a machine that could remember patterns. This innovation marked the beginning of externalized, symbolic memory for controlling machines.
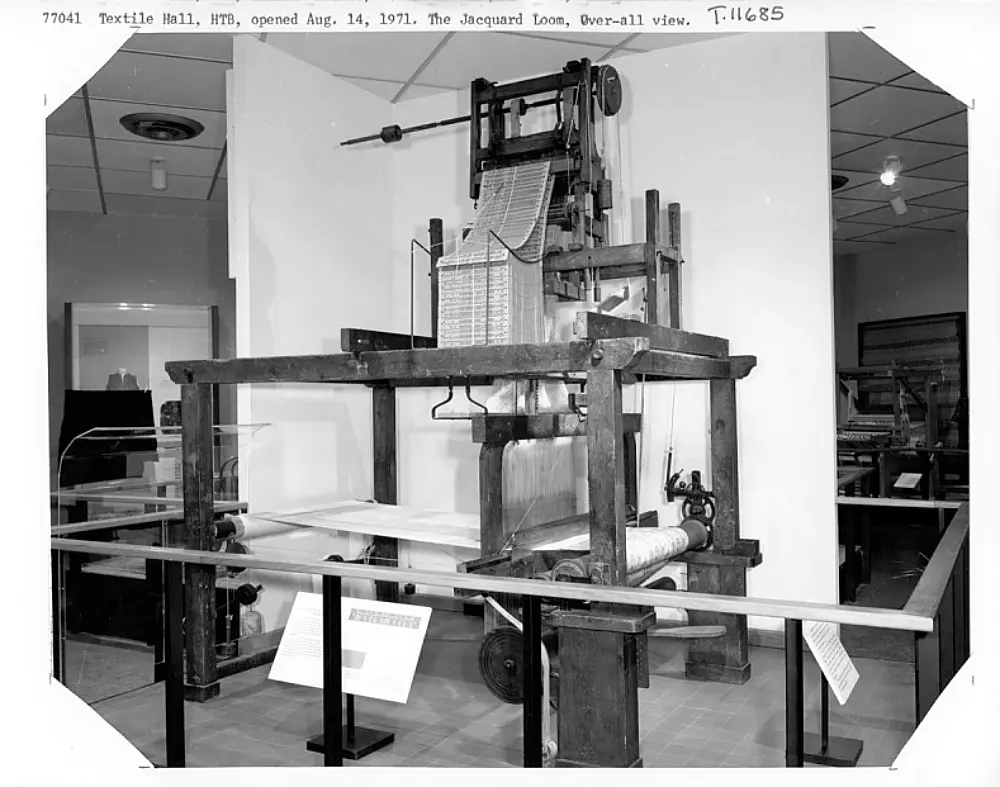
Jacquard loom with punch cards (c. 1840). The punched card mechanism controlled warp threads, enabling automated weaving of complex patterns. Source: National Museum of American History
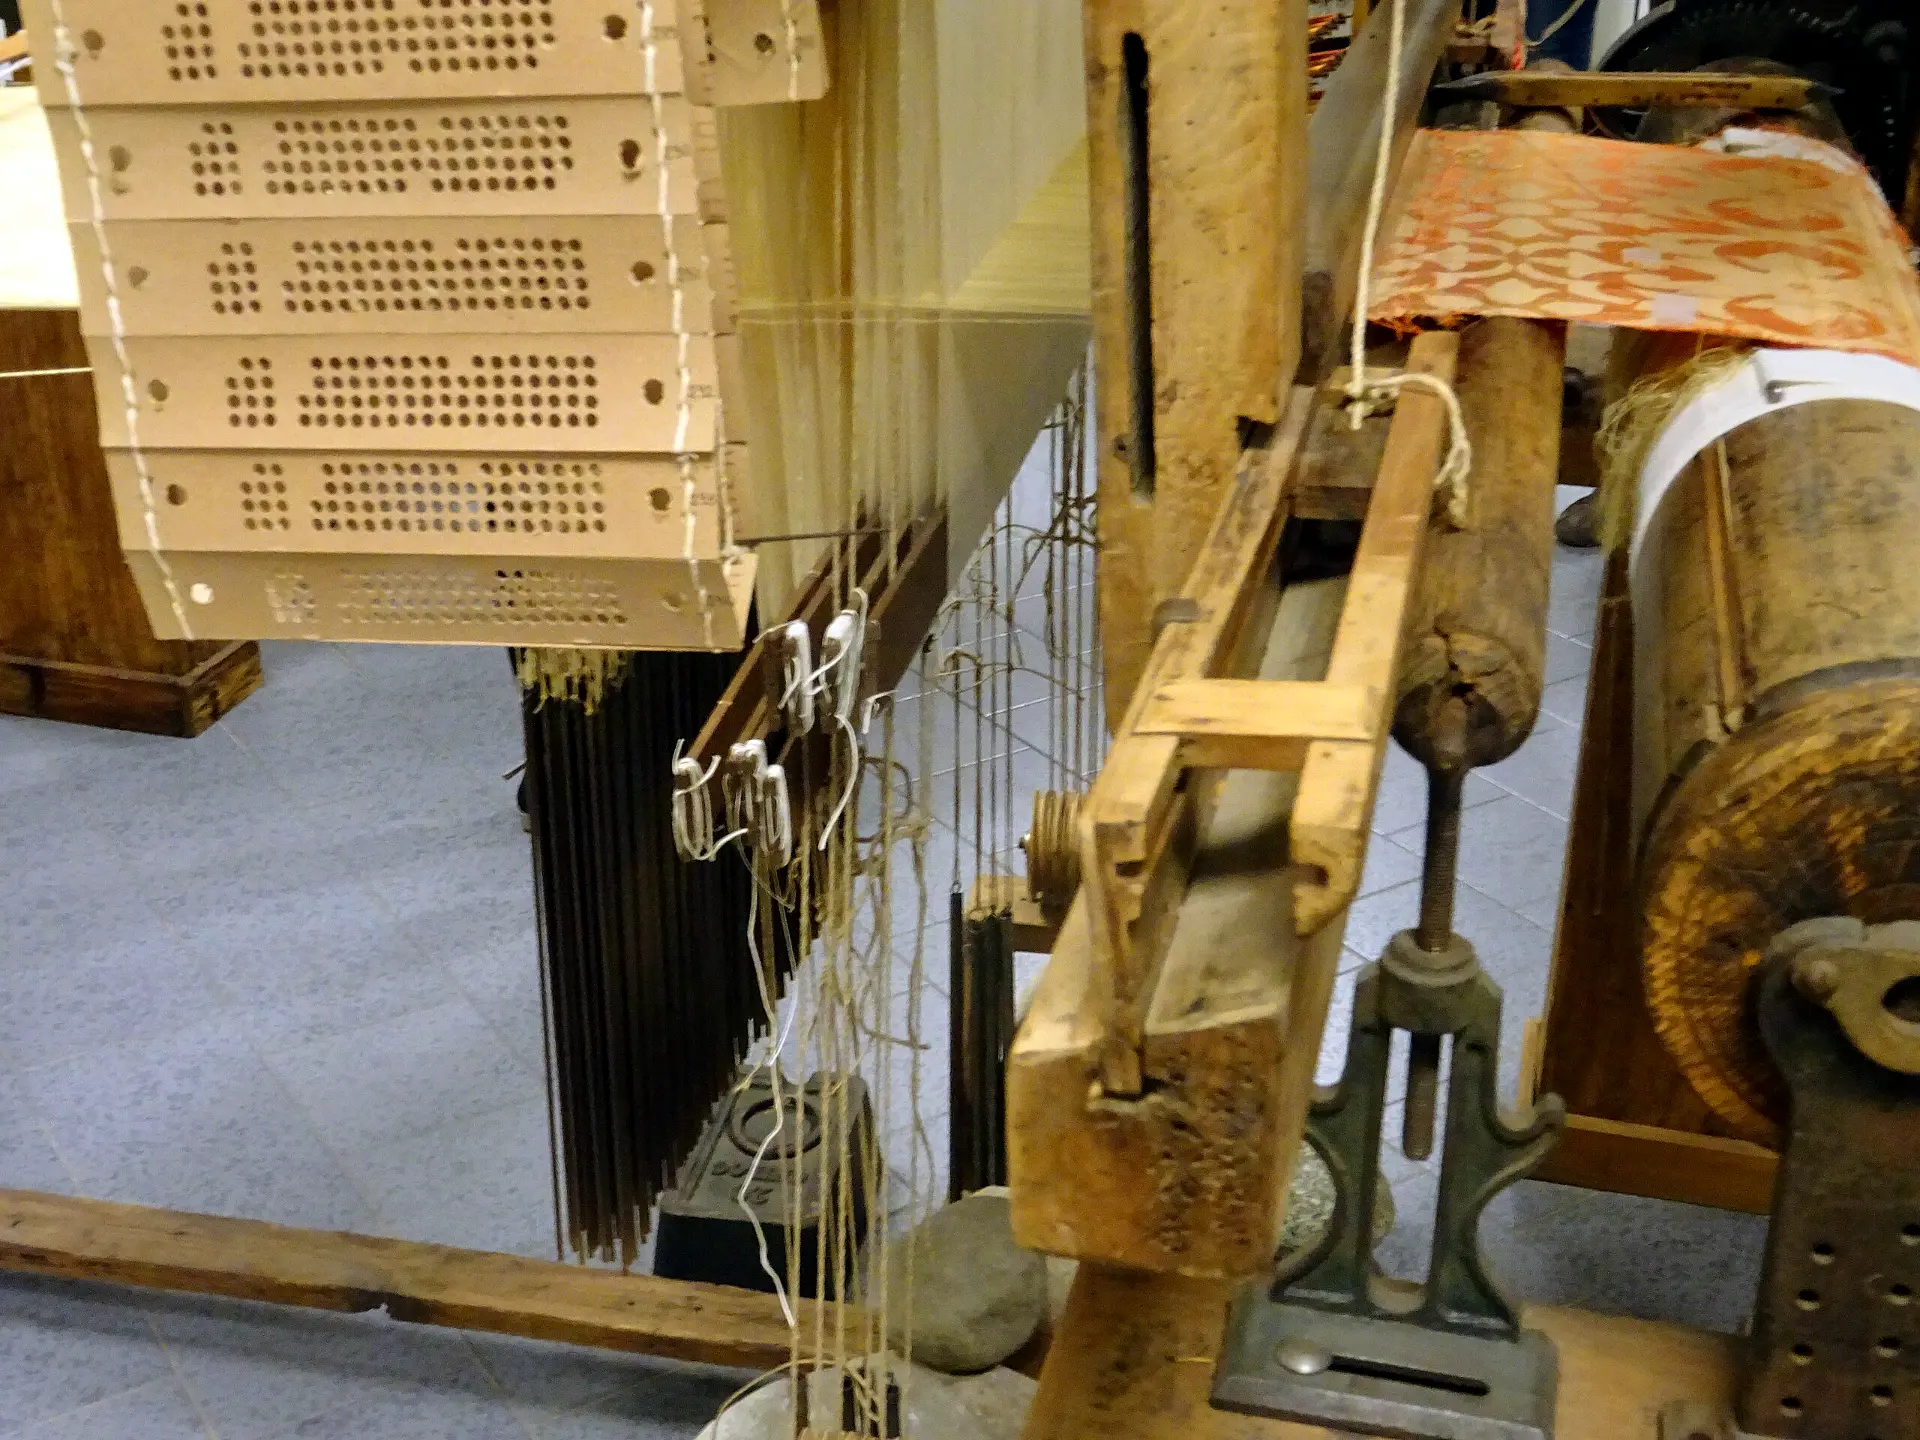
Chain of 8×26 hole punched cards used to program weaving patterns (early 19th century). Source.
By 1804, Joseph-Marie Jacquard refined this concept into a fully automated loom using punched cards. Each row of holes controlled which warp threads were lifted, encoding textile patterns in binary sequences.
These punch cards enabled repeatability, modularity, and the separation of logic from mechanics. The loom became a programmable system — its behavior governed by structured data. Charles Babbage later cited Jacquard’s cards as direct inspiration for programming his Analytical Engine, applying the same logic to mathematical computation. Textile control became abstract logic.
Digital aesthetics of the 1990s have deep roots in Jacquard weaving, where each punch is a bit and each row a line of code. Image generated by authors.

Digital aesthetics of the 1990s have deep roots in Jacquard weaving, where each punch is a bit and each row a line of code. Image generated by authors.
A11_JACQUARD_BINARY
A13_HOLLERITH_TABULATOR
The importance of the Jacquard loom lies less in weaving than in abstraction. It marked the moment when patterns became code — transferable sequences that could be stored, reused, and combined. What had once been tacit craft knowledge was recast as programmable logic. This conceptual leap — treating instructions as independent data — is what made later computational systems imaginable.
A13_HOLLERITH_TABULATOR

From Loom to Census — Herman Hollerith and the Birth of Data Machines
By 1880, the U.S. Census had become a monumental paper problem. Processing returns by hand had taken nearly a decade — far too long for a modern bureaucracy. To break the bottleneck, a young engineer named Herman Hollerith turned to a familiar source: punch cards, inspired by Jacquard looms and railway tickets.
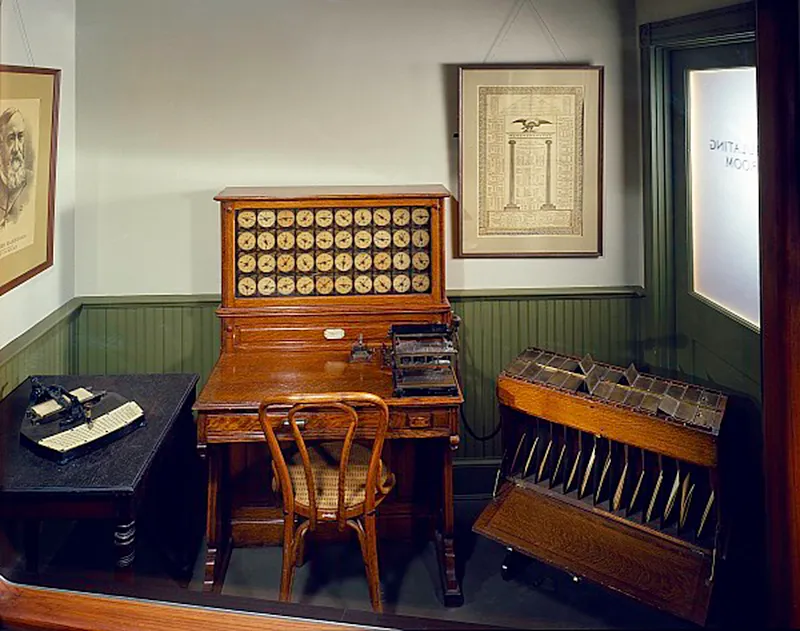
Tabulating machine by Herman Hollerith (c. 1890). Its punch-card system adapted the Jacquard method for demographic counting. Source: American History museum
Hollerith’s breakthrough wasn’t the cards themselves, but the electromechanical system that could read them. His 1889 tabulator used metal pins to detect holes in a card and close electrical circuits, counting data categories automatically. With custom sorters and punched templates, information could be processed faster than ever before — and with far less human labor.
A13_HOLLERITH_TABULATOR
A2_Rationalizing the World
What Hollerith introduced was not just a faster way to count but a new relationship between people and data. Populations were redefined as machine-processable units, and governance began to depend on the categories a system could recognize. The conceptual shift was profound: data processing became a condition of modern administration.
A2
Rationalizing the World: Data, Design, and the Logic of Representation
Transforming the real world into records, scripts, and protocols gave writing a double power: permanence and authority. To inscribe was to decide — which harvests to count, which families to list, which debts to record. The written word condensed reality into a fixed, portable form, turning choices into facts. What began as memory externalized soon became governance encoded, where the act of writing itself structured power.
By the early modern era, this logic intensified. Political arithmetic and statistics reframed societies as measurable systems, while new visual models translated abstractions into curves, tables, and diagrams. Representation became its own form of processing — reducing lived complexity into formats that could be compared, manipulated, and controlled.
A21_EARLY_STATISTICS

Counting to Govern — Political Arithmetic and Early Statistics
Long before mechanical tabulators, governments used data to exert control. In early modern Europe, the rise of absolutist states brought new pressures to measure, compare, and forecast populations. Inspired by older registers like the Domesday Book, a new intellectual tradition emerged in the 17th century: political arithmetic.
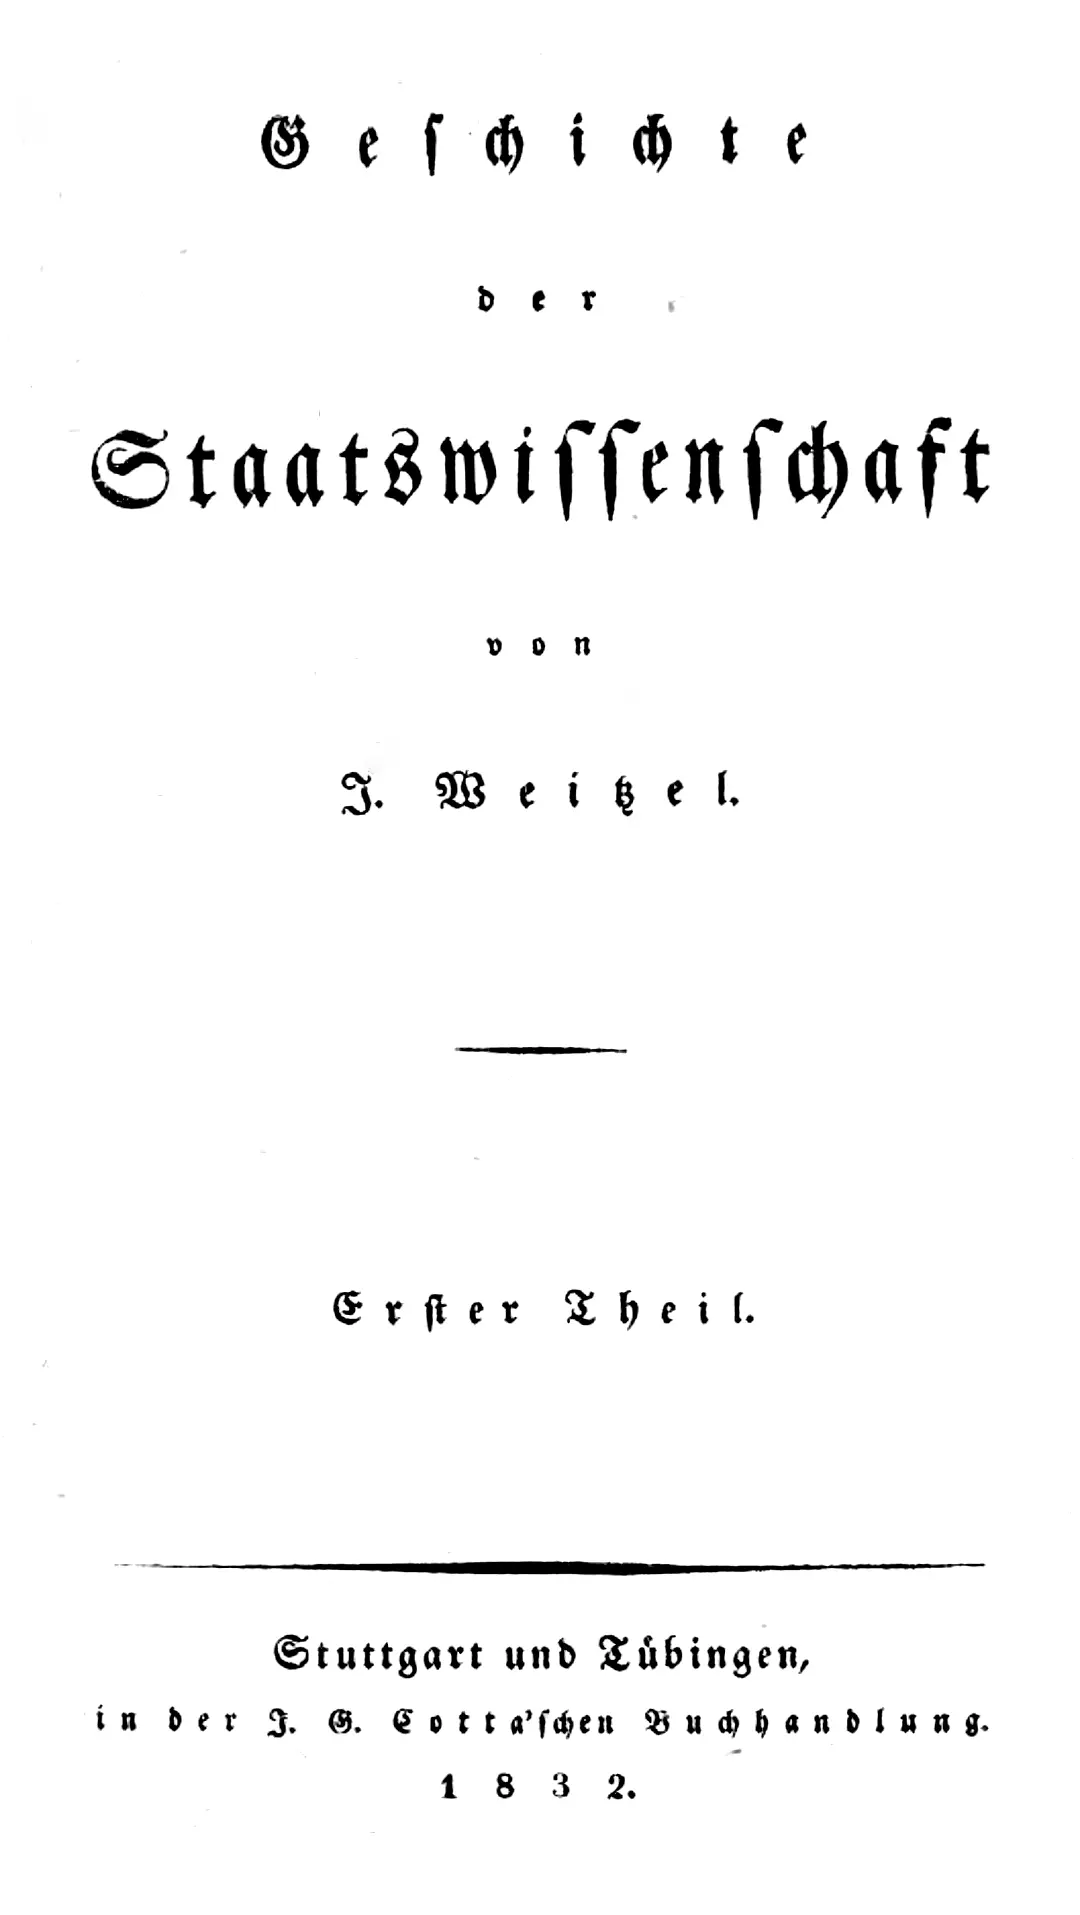
Title page of Johannes Weitzel’s “Geschichte der Staatswissenschaft” (early 19th century), reflecting the formalization of state science as an academic and administrative discipline in German-speaking regions. Source
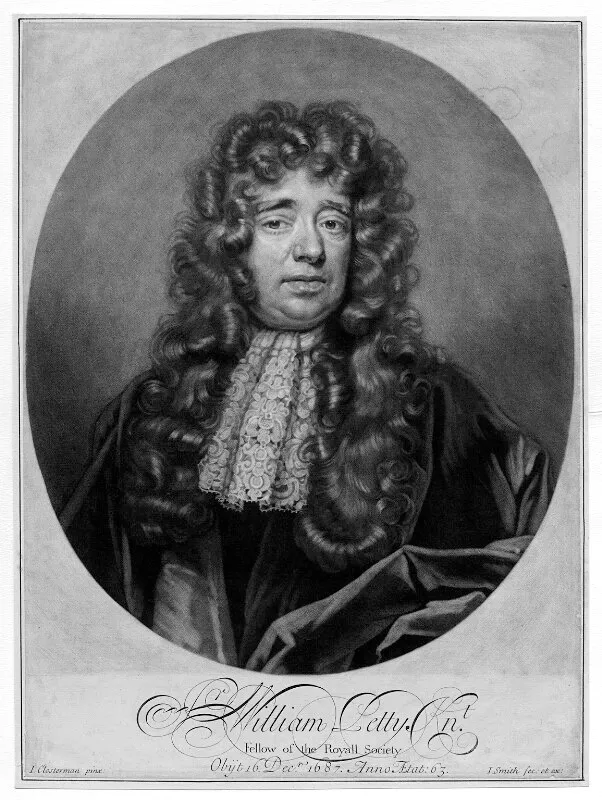
William Petty (1623–1687), pioneer of political arithmetic. His demographic and economic analyses laid foundations for modern statistical governance. Source
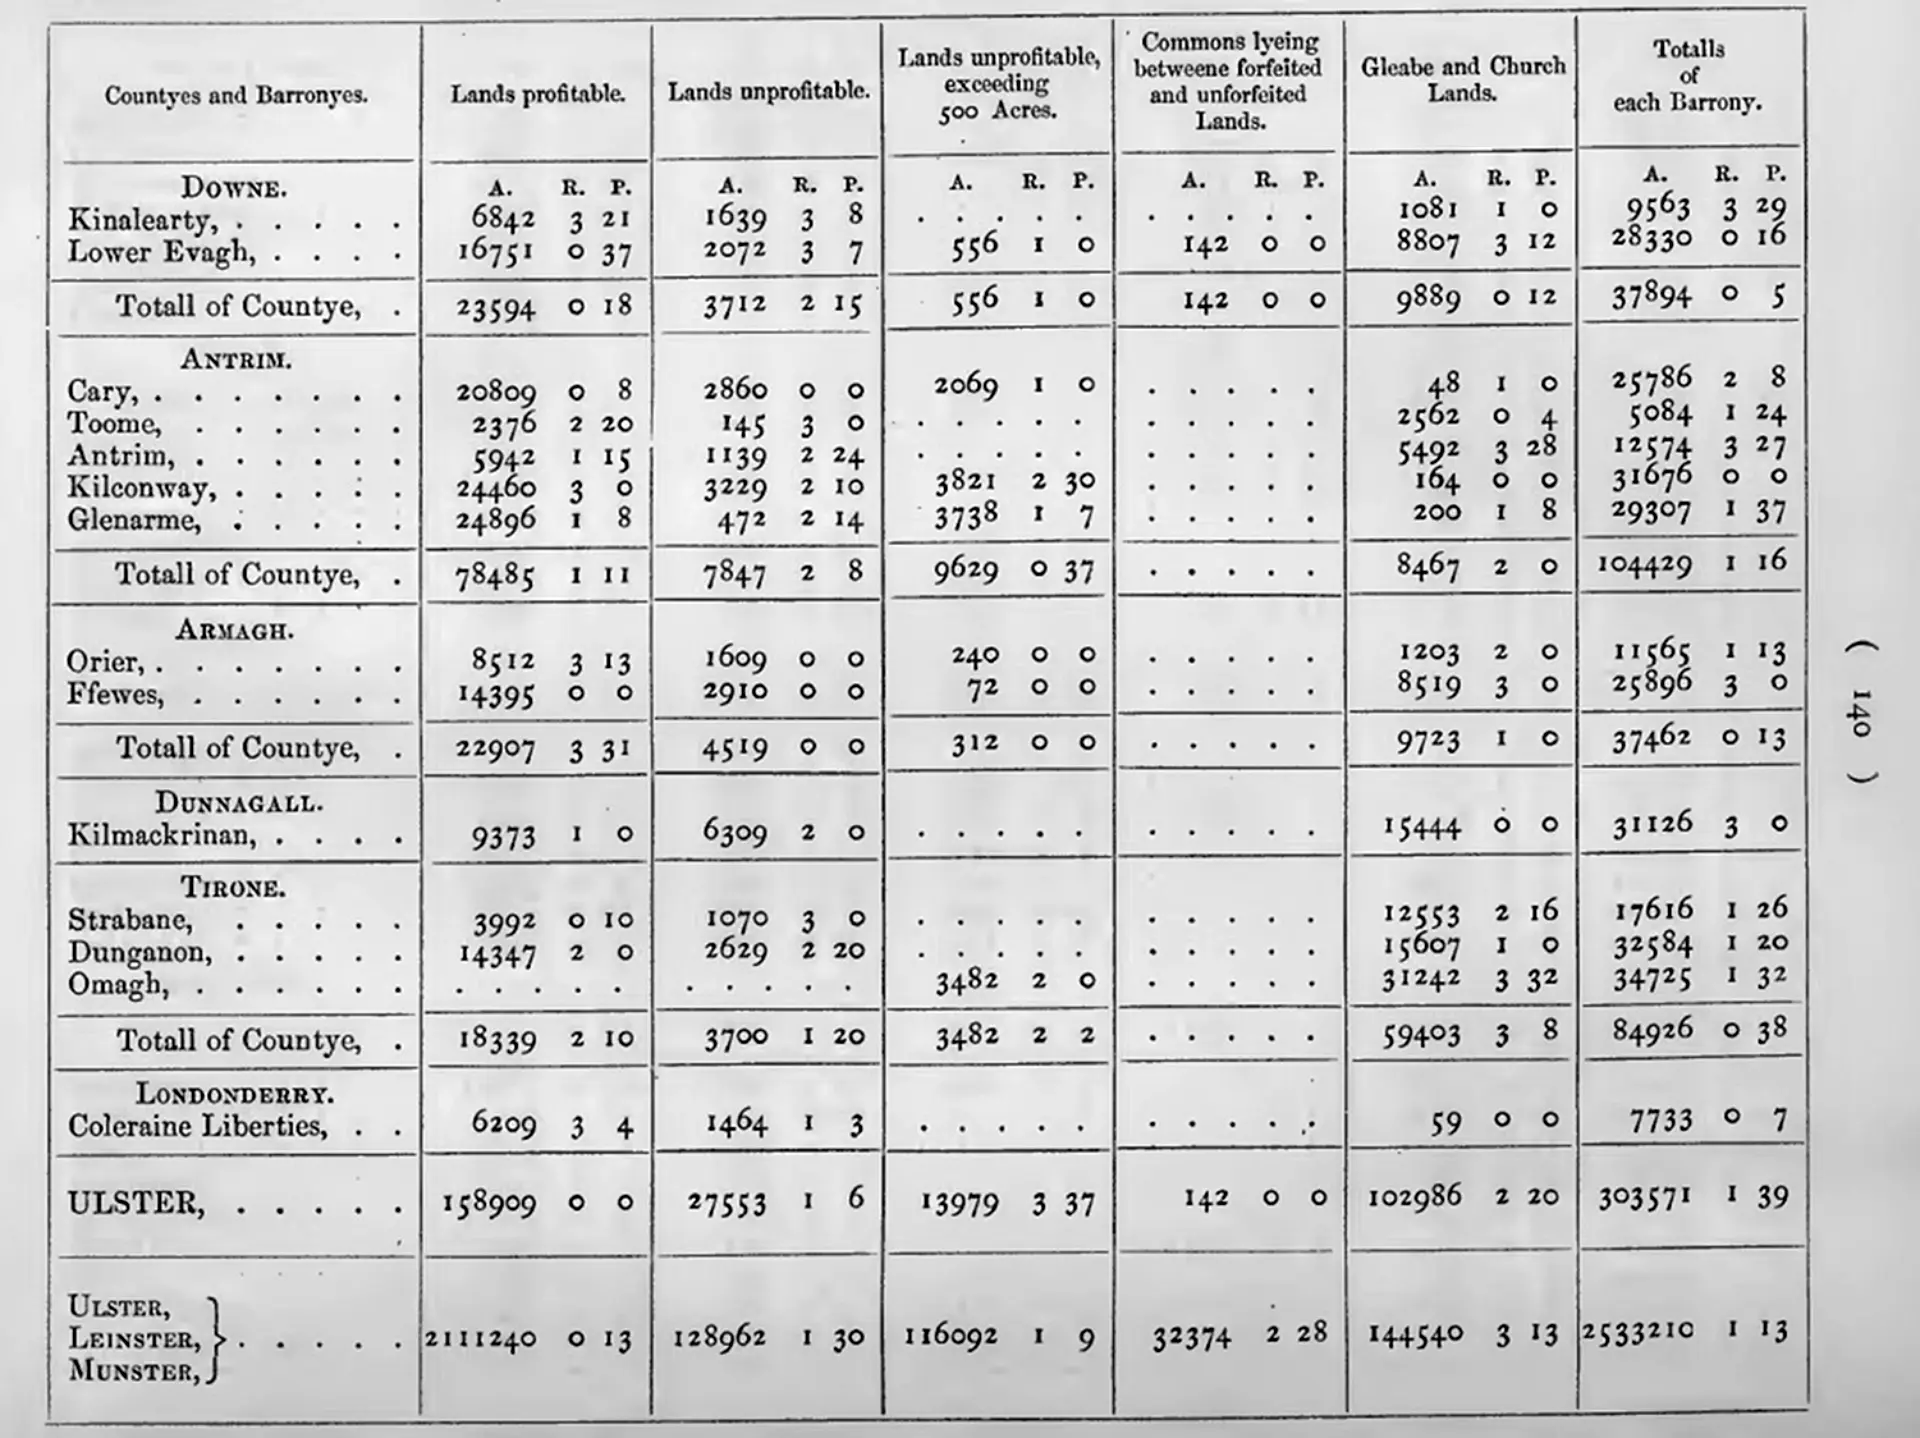
Table from the Down Survey (1655–1656), an early large-scale land and property data collection in Ireland under William Petty, using tabular methods to inform colonial administration. Source
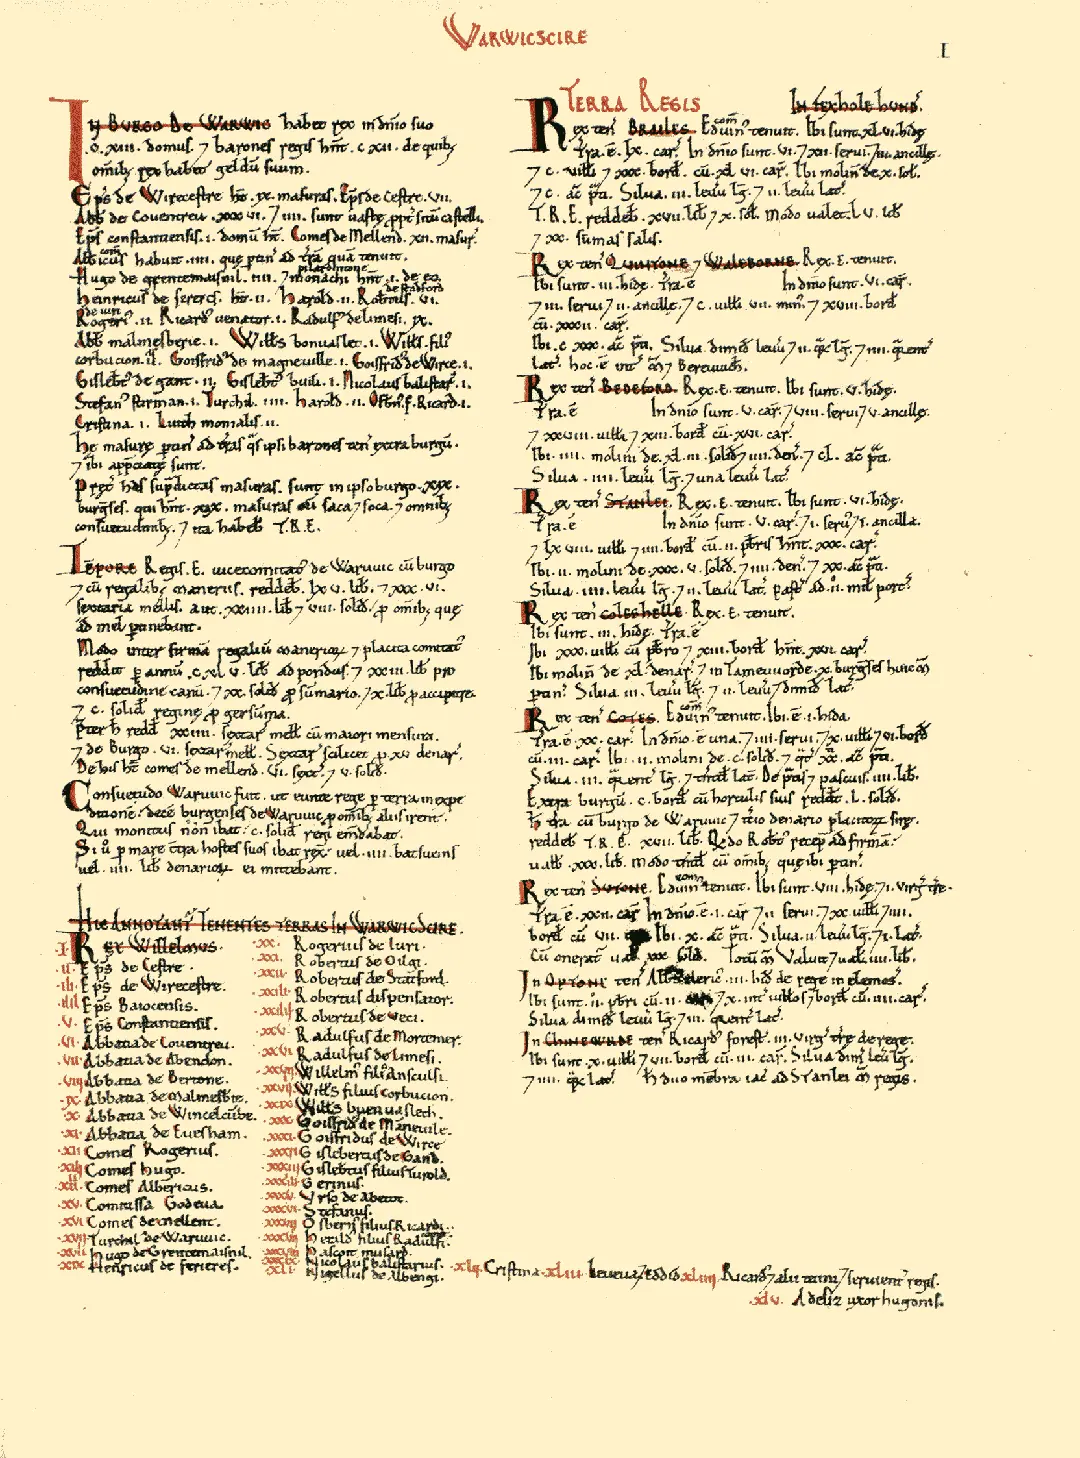
Folio from the Domesday Book (1086), detailing Warwickshire. Part of William the Conqueror’s survey of English landholdings, one of Europe’s earliest centralized census efforts. Open Domesday
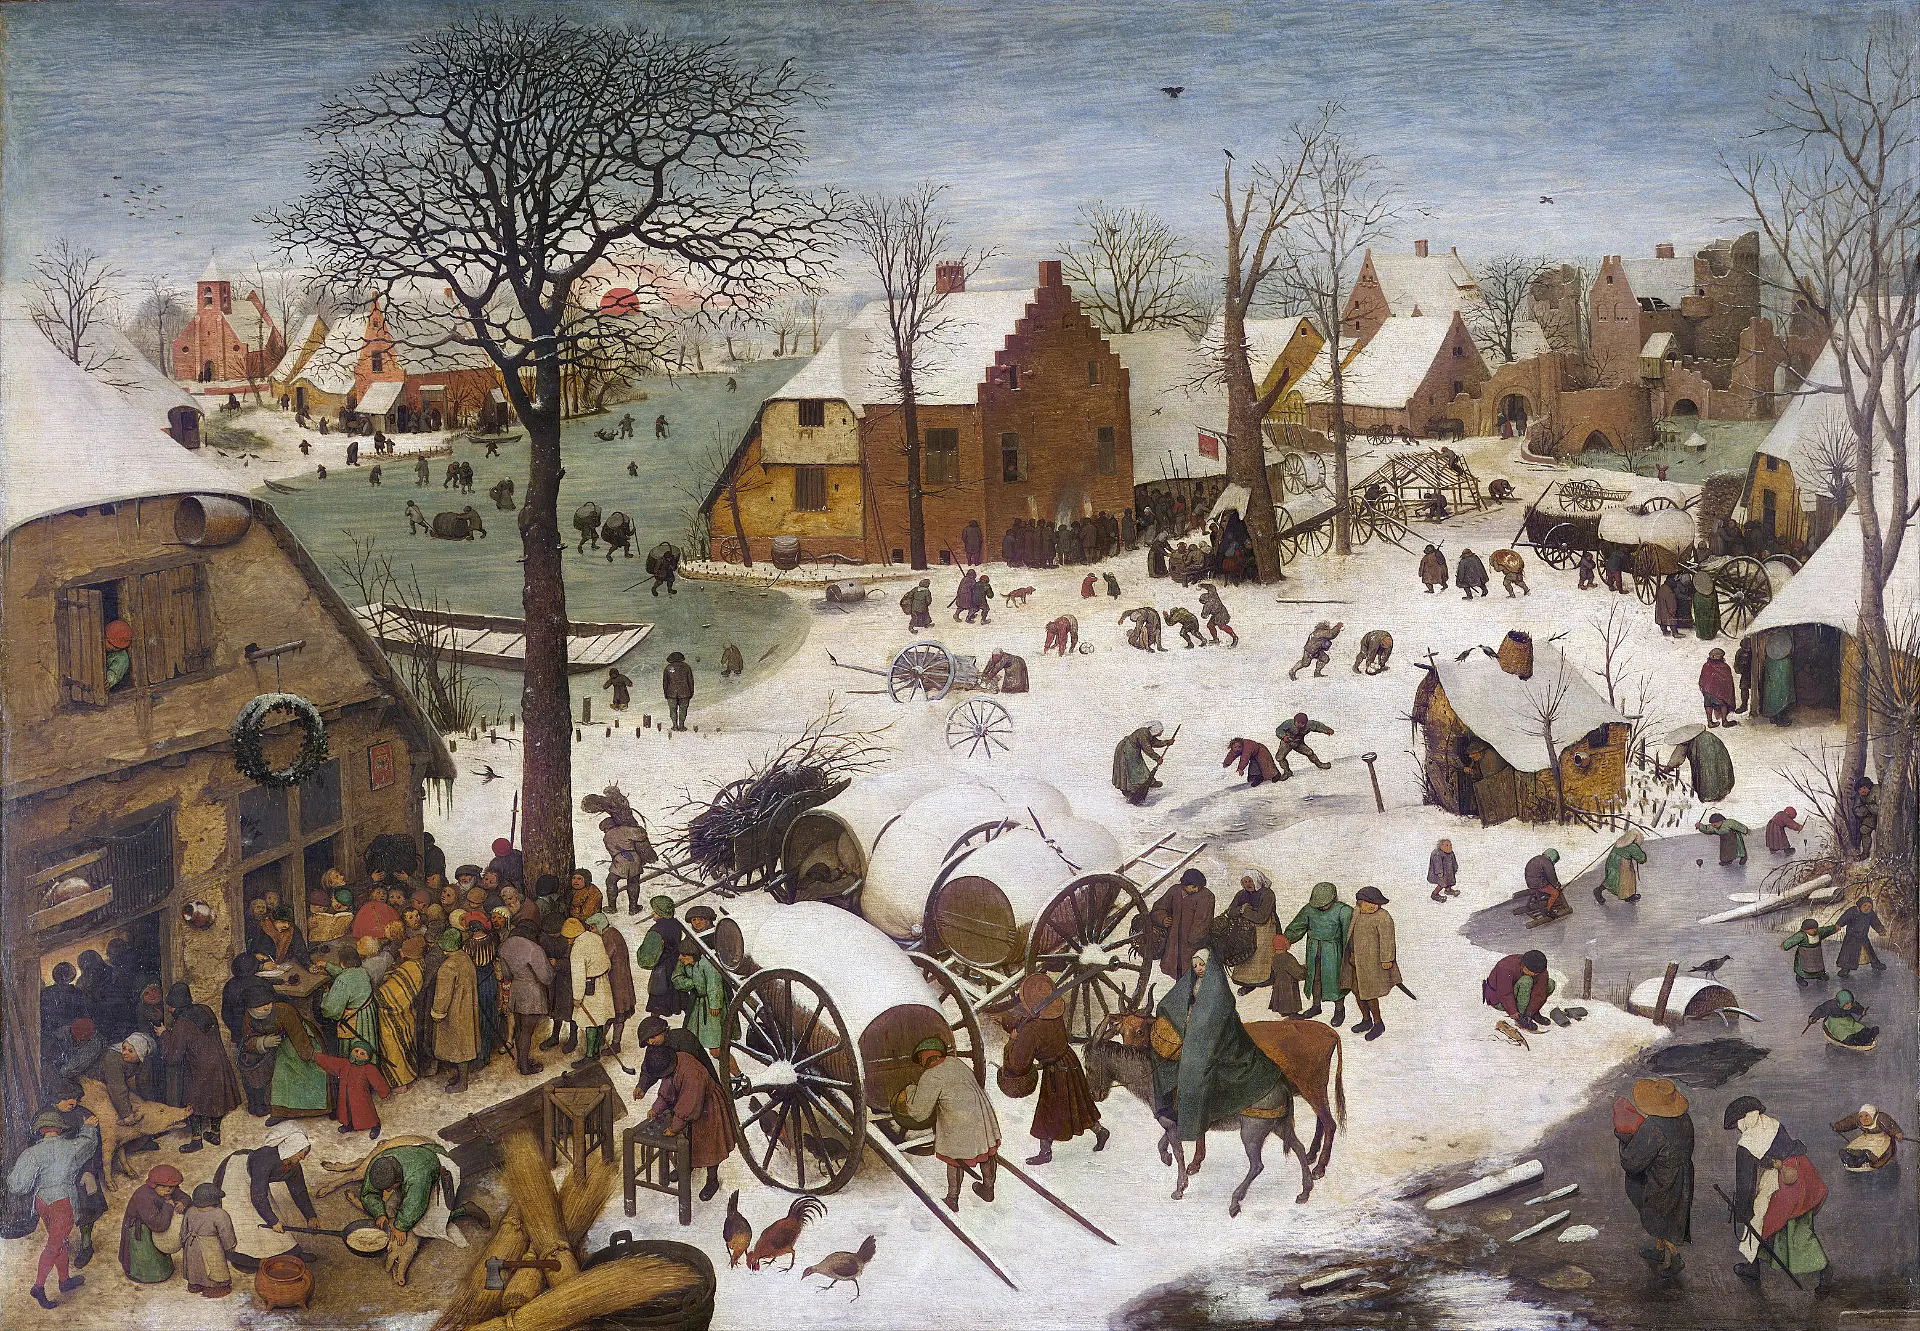
Pieter Bruegel the Elder, “The Census at Bethlehem” (1566), a Flemish reinterpretation of the biblical census that blends daily life with state authority in early modern administrative culture. Source
Pioneers like John Graunt and William Petty introduced statistical summaries of mortality and trade in London, proposing that societies could be studied mathematically. In German-speaking states, this formalized into Staatswissenschaft — the “science of the state” — combining demographic counts, land surveys, and resource assessments into a toolkit for rational administration
A21_EARLY_STATISTICS
A24_INSTITUTIONAL_CARDS
Political arithmetic reframed governance as a matter of calculation. Lives, land, and trade were translated into numbers that could be compared, projected, and acted upon. This was processing in its most political form — abstraction as a tool of control. Once rulers had begun to see societies as datasets, it was only a matter of time before machines like Hollerith’s tabulator were absorbed into the bureaucratic machinery, making the arithmetic of states permanent.
A24_INSTITUTIONAL_CARDS

Tabulated Society — Punched Cards in Government and Business
After the success of the 1890 U.S. Census, punched card machines quickly became a pillar of state and corporate infrastructure. Already in 1891, governments in Canada, Norway, and Austria had adopted versions of punch-card tabulators for their own censuses.
Then, Hollerith’s systems — now under the Computing-Tabulating-Recording Company (CTR), which later became IBM — expanded from population counts to civil registries, tax records, military logistics, and industrial payroll.
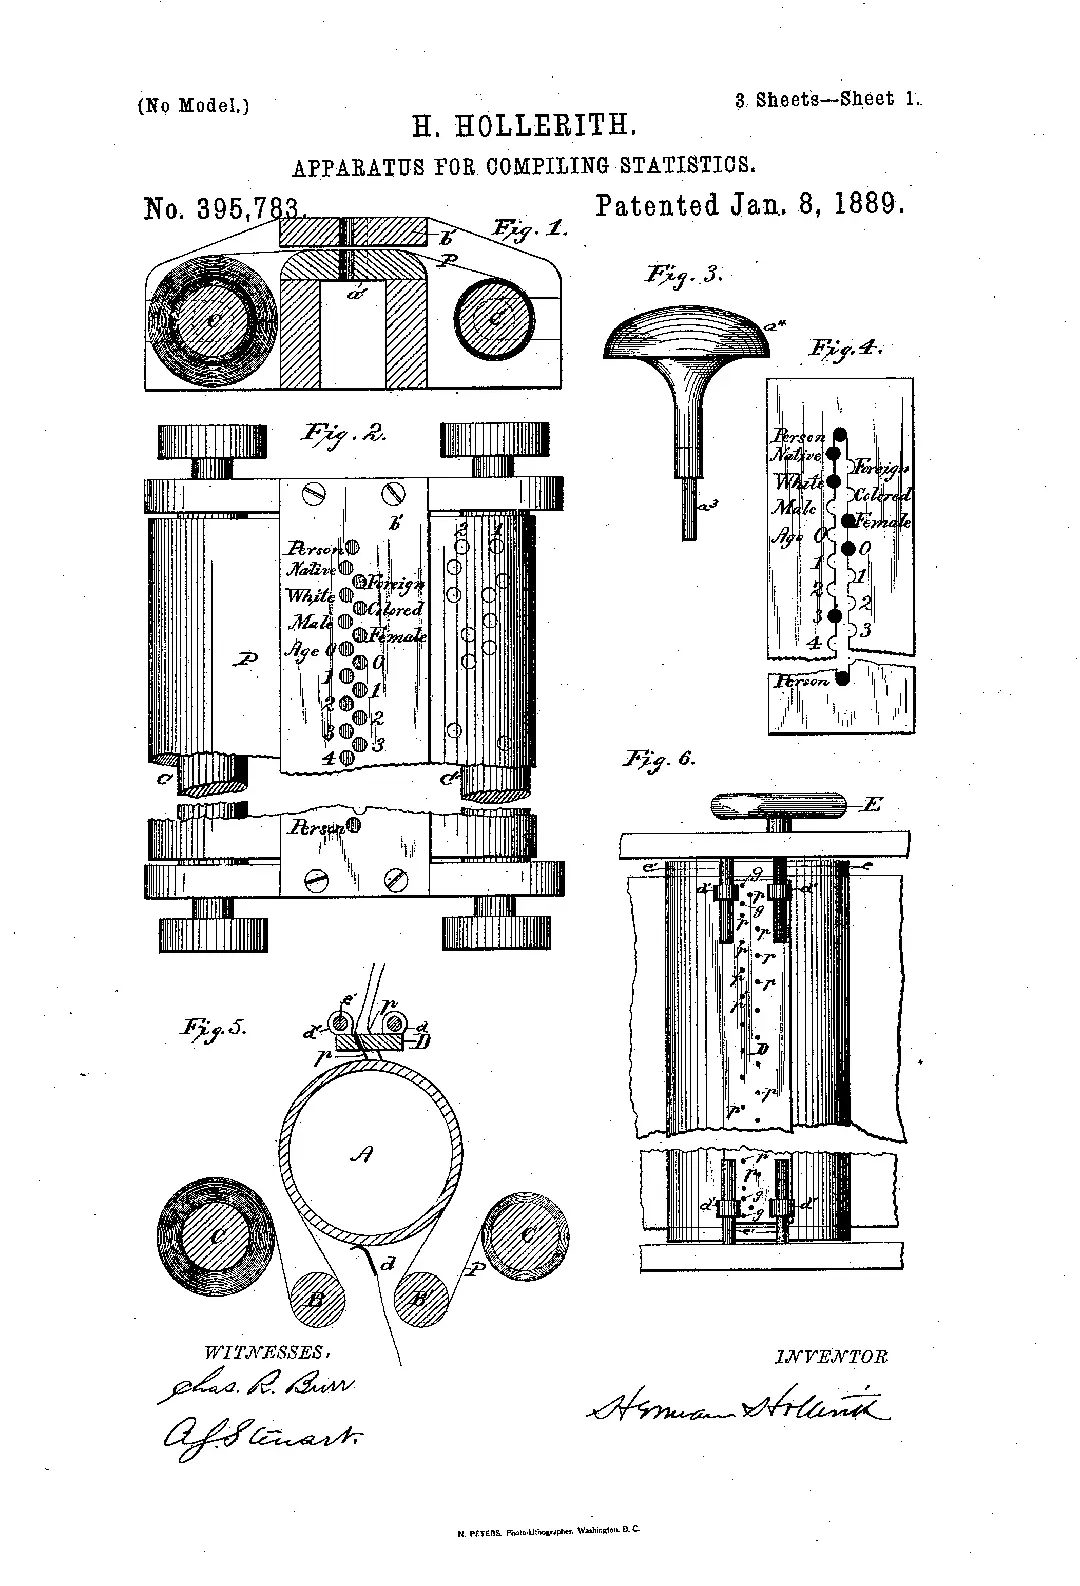
Hollerith’s U.S. patents (Nos. 395,781–783, 1889), collectively describing his invention as the “Art of Compiling Statistics.” Google Patents
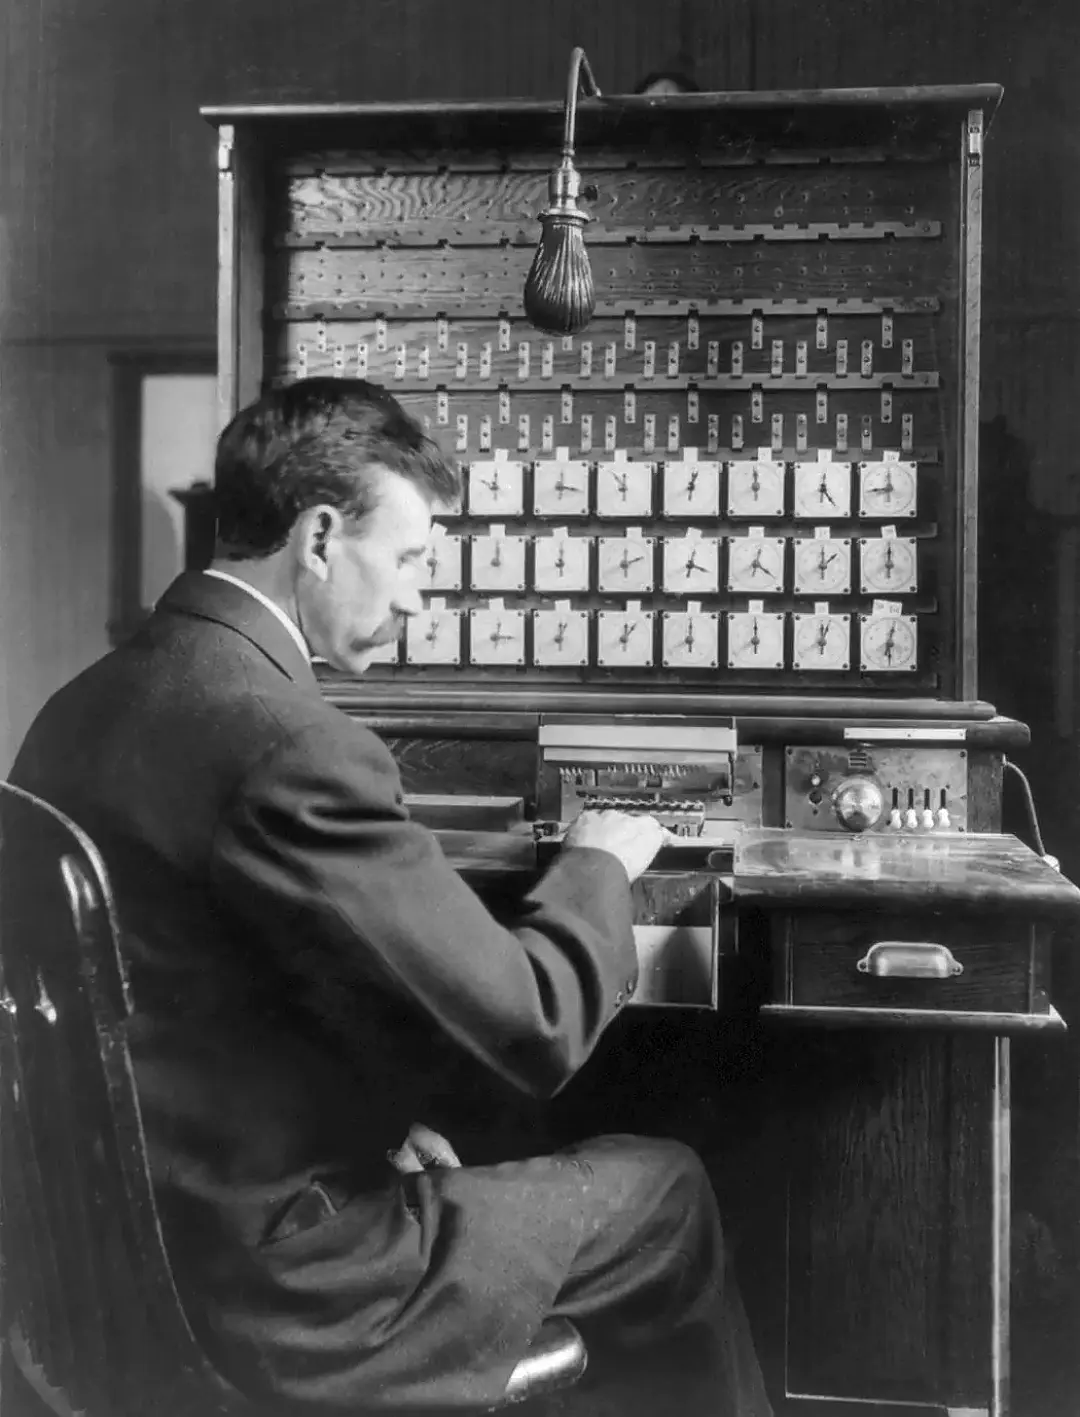
Herman Hollerith with his punch-card tabulating machine, used in the 1890 U.S. Census. Transcription required 72.5 hours (twice as fast as competitors), while tabulation took only 5.5 hours (ten times faster). MIT Technology Review
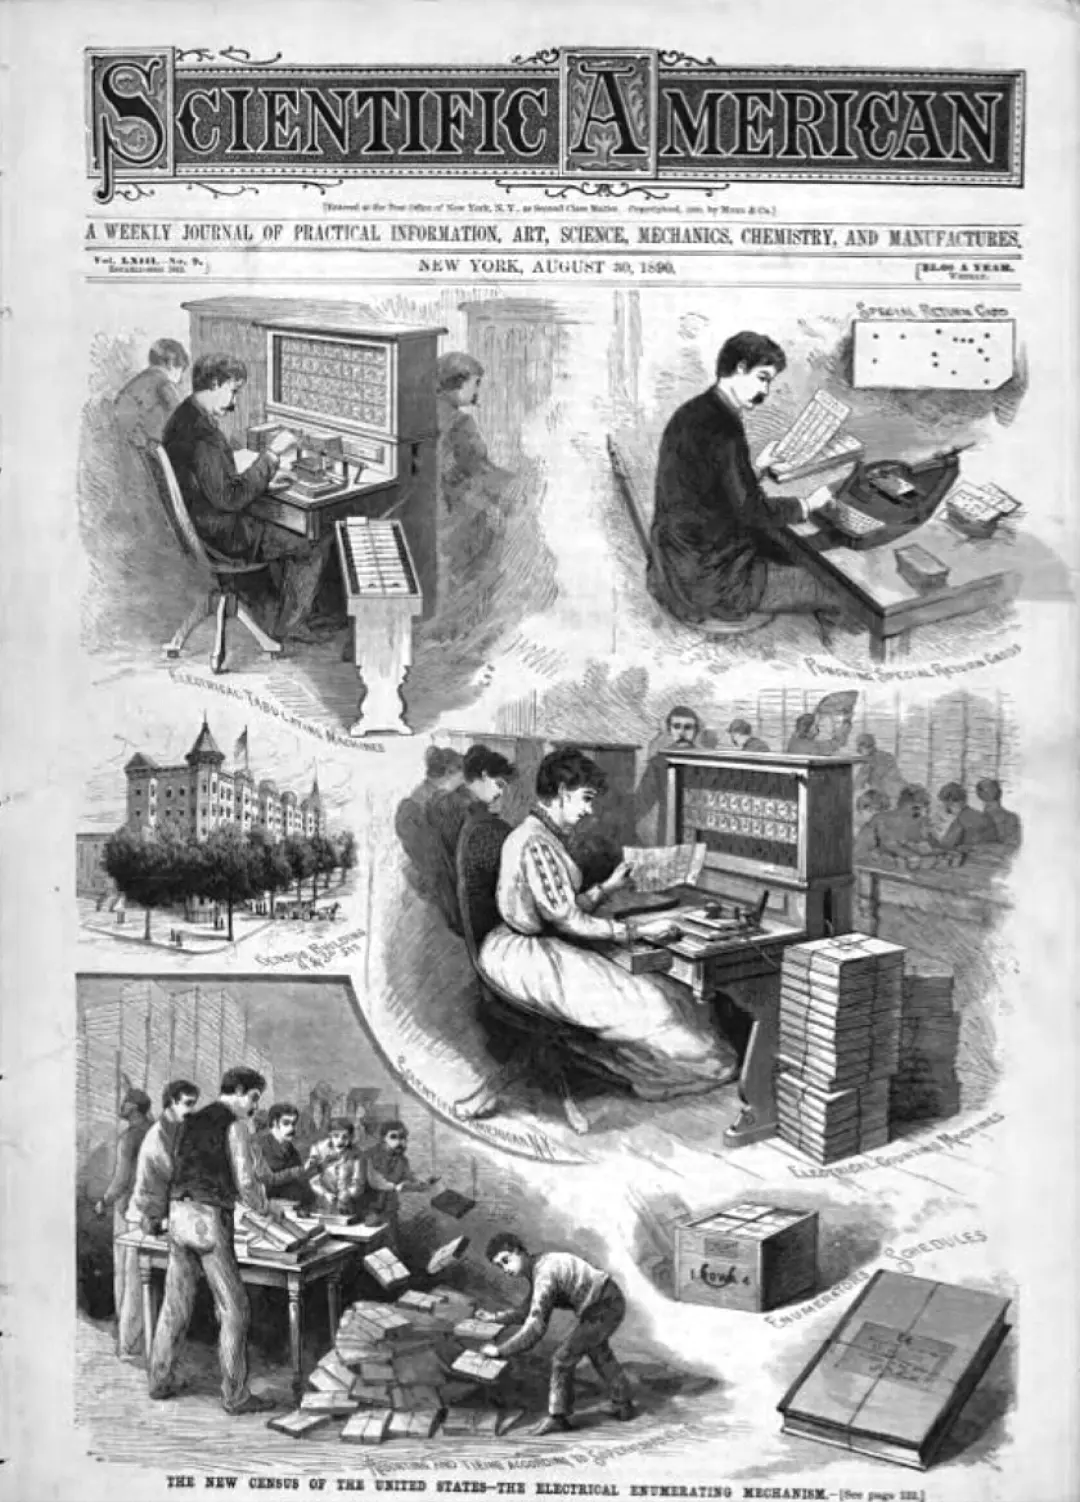
Scientific American, August 1890, featuring Hollerith’s census machine. From the collection of Dr. Sid Kolpas. Mathematical Association of America
In Europe, punched card tabulators were used to track unemployment during the Weimar Republic and later for darker purposes under totalitarian regimes. In the U.S., corporations adopted the technology to manage workers and inventories. Punched cards became tokens of identity: each card a fragile stand-in for a worker, a file, a life — processed at scale.
Their layout became standardized: 80 columns, rectangular holes, precise rows. What began as a statistical tool evolved into a universal format for encoding human activity. This expansion paved the way for mainframe computing, but it also quietly embedded new logics of sorting, surveillance, and abstraction — long before digital systems arrived.
A24_INSTITUTIONAL_CARDS
A3_Enumerating the World
Punched card systems changed the scale of data processing. No longer tied to a single loom or census, they became the connective tissue of states and corporations. Civil registries, payrolls, tax records, and inventories all began to flow through standardized cards and tabulators.
Processing here was not invention but normalization — a logic absorbed into institutions until bureaucracy itself depended on it. To see how deep these habits ran, we need to rewind to older traditions of counting, where enumeration was less about machines than about ritual order.
A3
Enumerating the World: Counting as Ritual, Power, and Abstraction
Transforming the real world into records, scripts, and protocols gave writing a double power: permanence and authority. To inscribe was to decide — which harvests to count, which families to list, which debts to record. The written word condensed reality into a fixed, portable form, turning choices into facts. What began as memory externalized soon became governance encoded, where the act of writing itself structured power.
By the early modern era, this logic intensified. Political arithmetic and statistics reframed societies as measurable systems, while new visual models translated abstractions into curves, tables, and diagrams. Representation became its own form of processing — reducing lived complexity into formats that could be compared, manipulated, and controlled.
A31_EARLY_ENUMERATION

Sacred Numbers and Civic Counts — Early Enumeration as Control and Ritual
Long before modern statistics, societies developed elaborate systems for counting people, goods, and time.
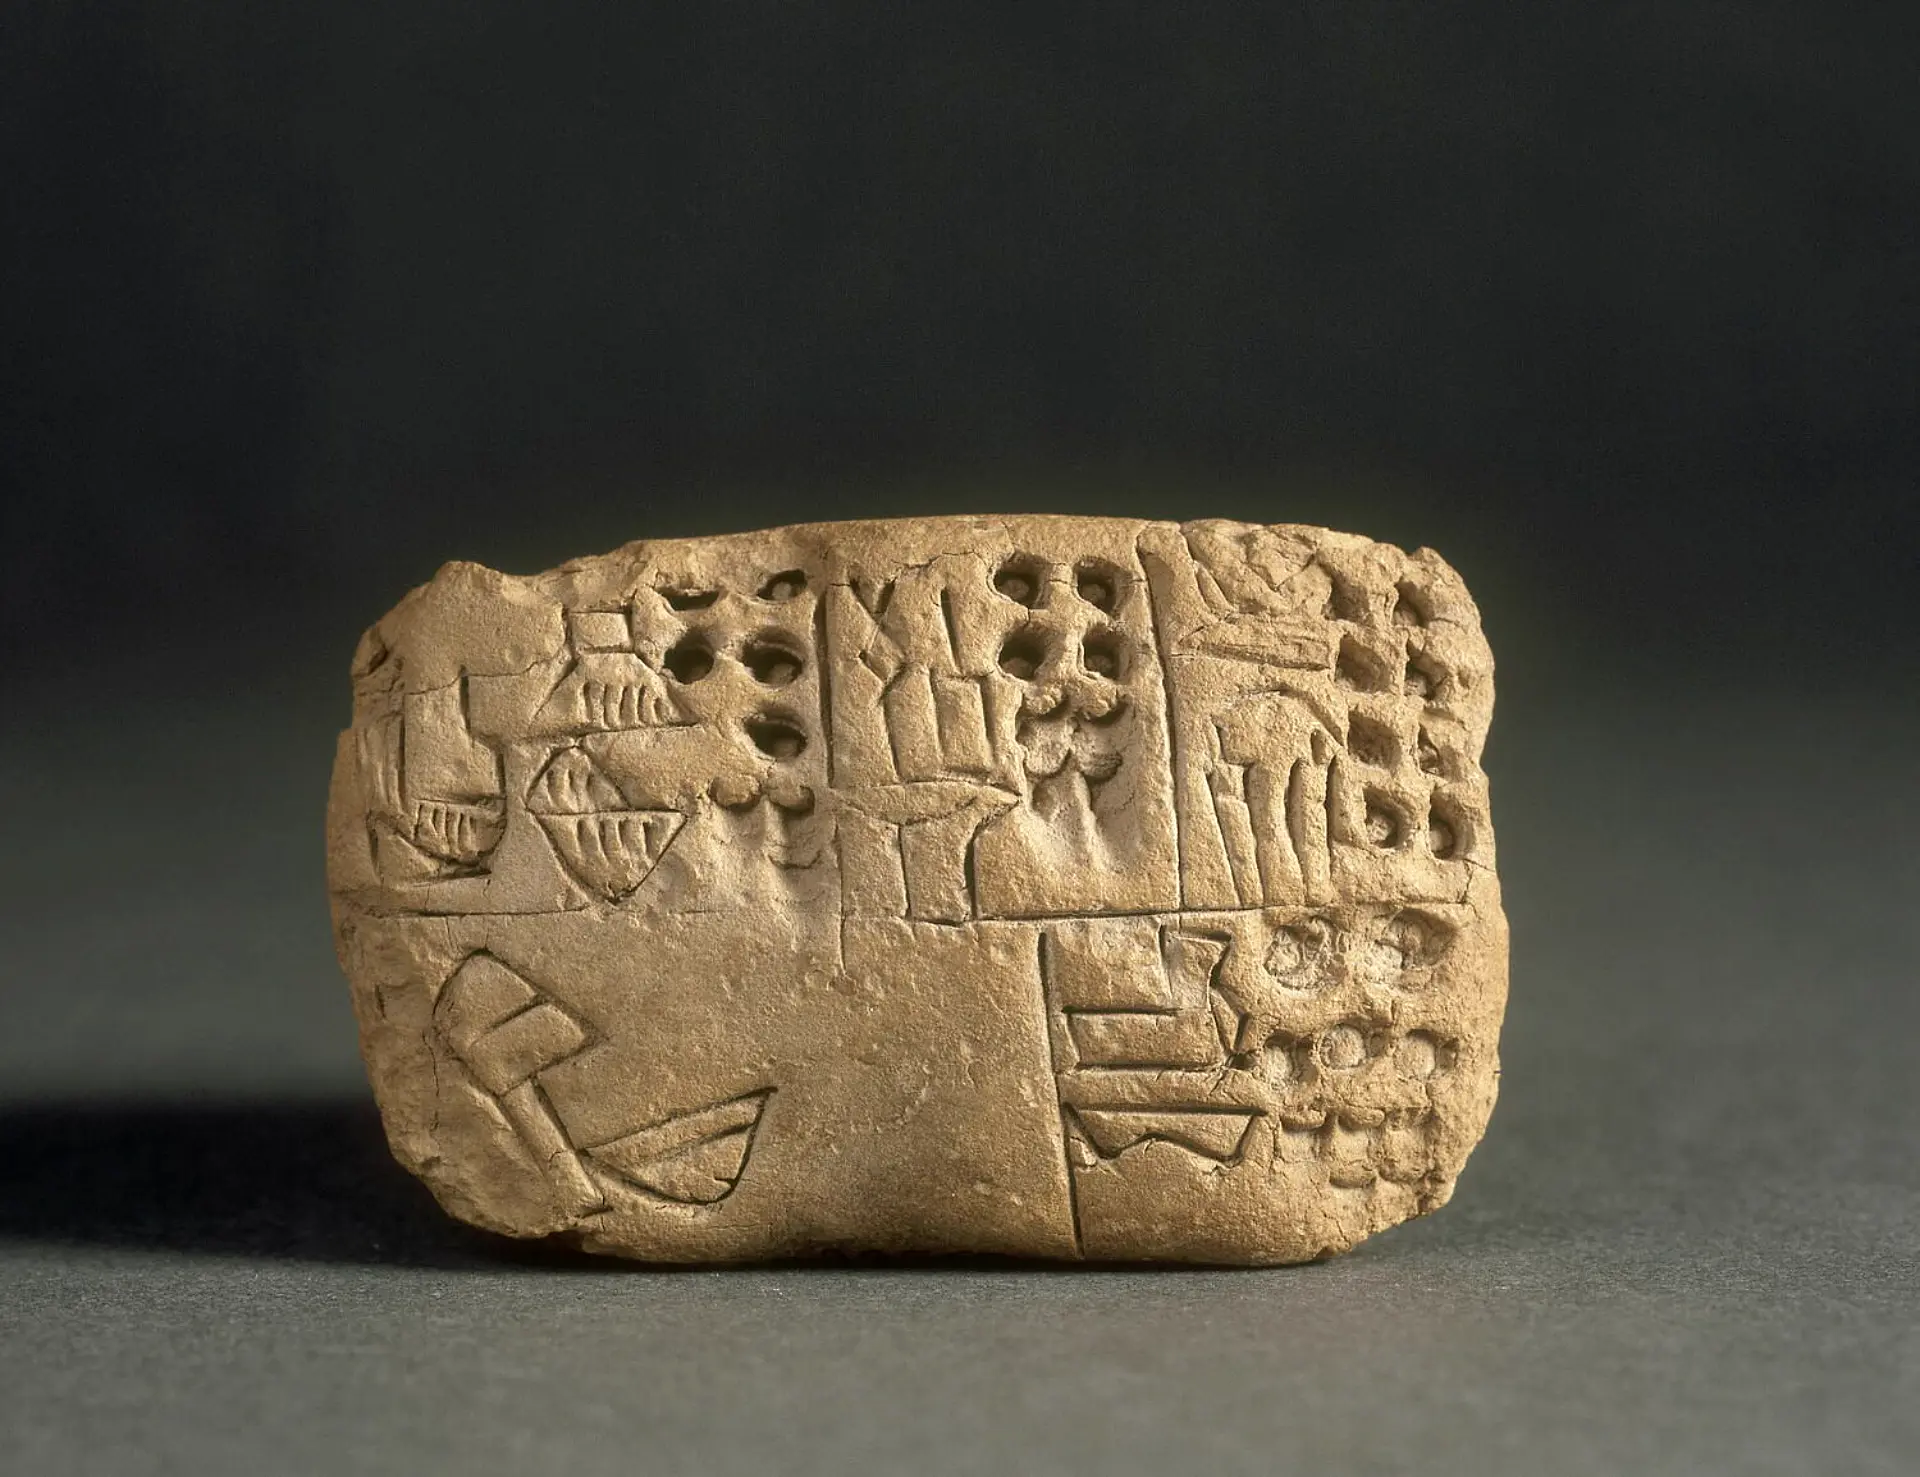
Cuneiform tablet (Sumer, c. 3000 BCE), used to record grain and livestock quantities as part of temple administration. Such artifacts enabled resource tracking, labor management, and redistribution across Mesopotamian city-states. Musée du Louvre, AO 29560. © 2002 GrandPalaisRmn (Musée du Louvre) / Franck Raux. Louvre
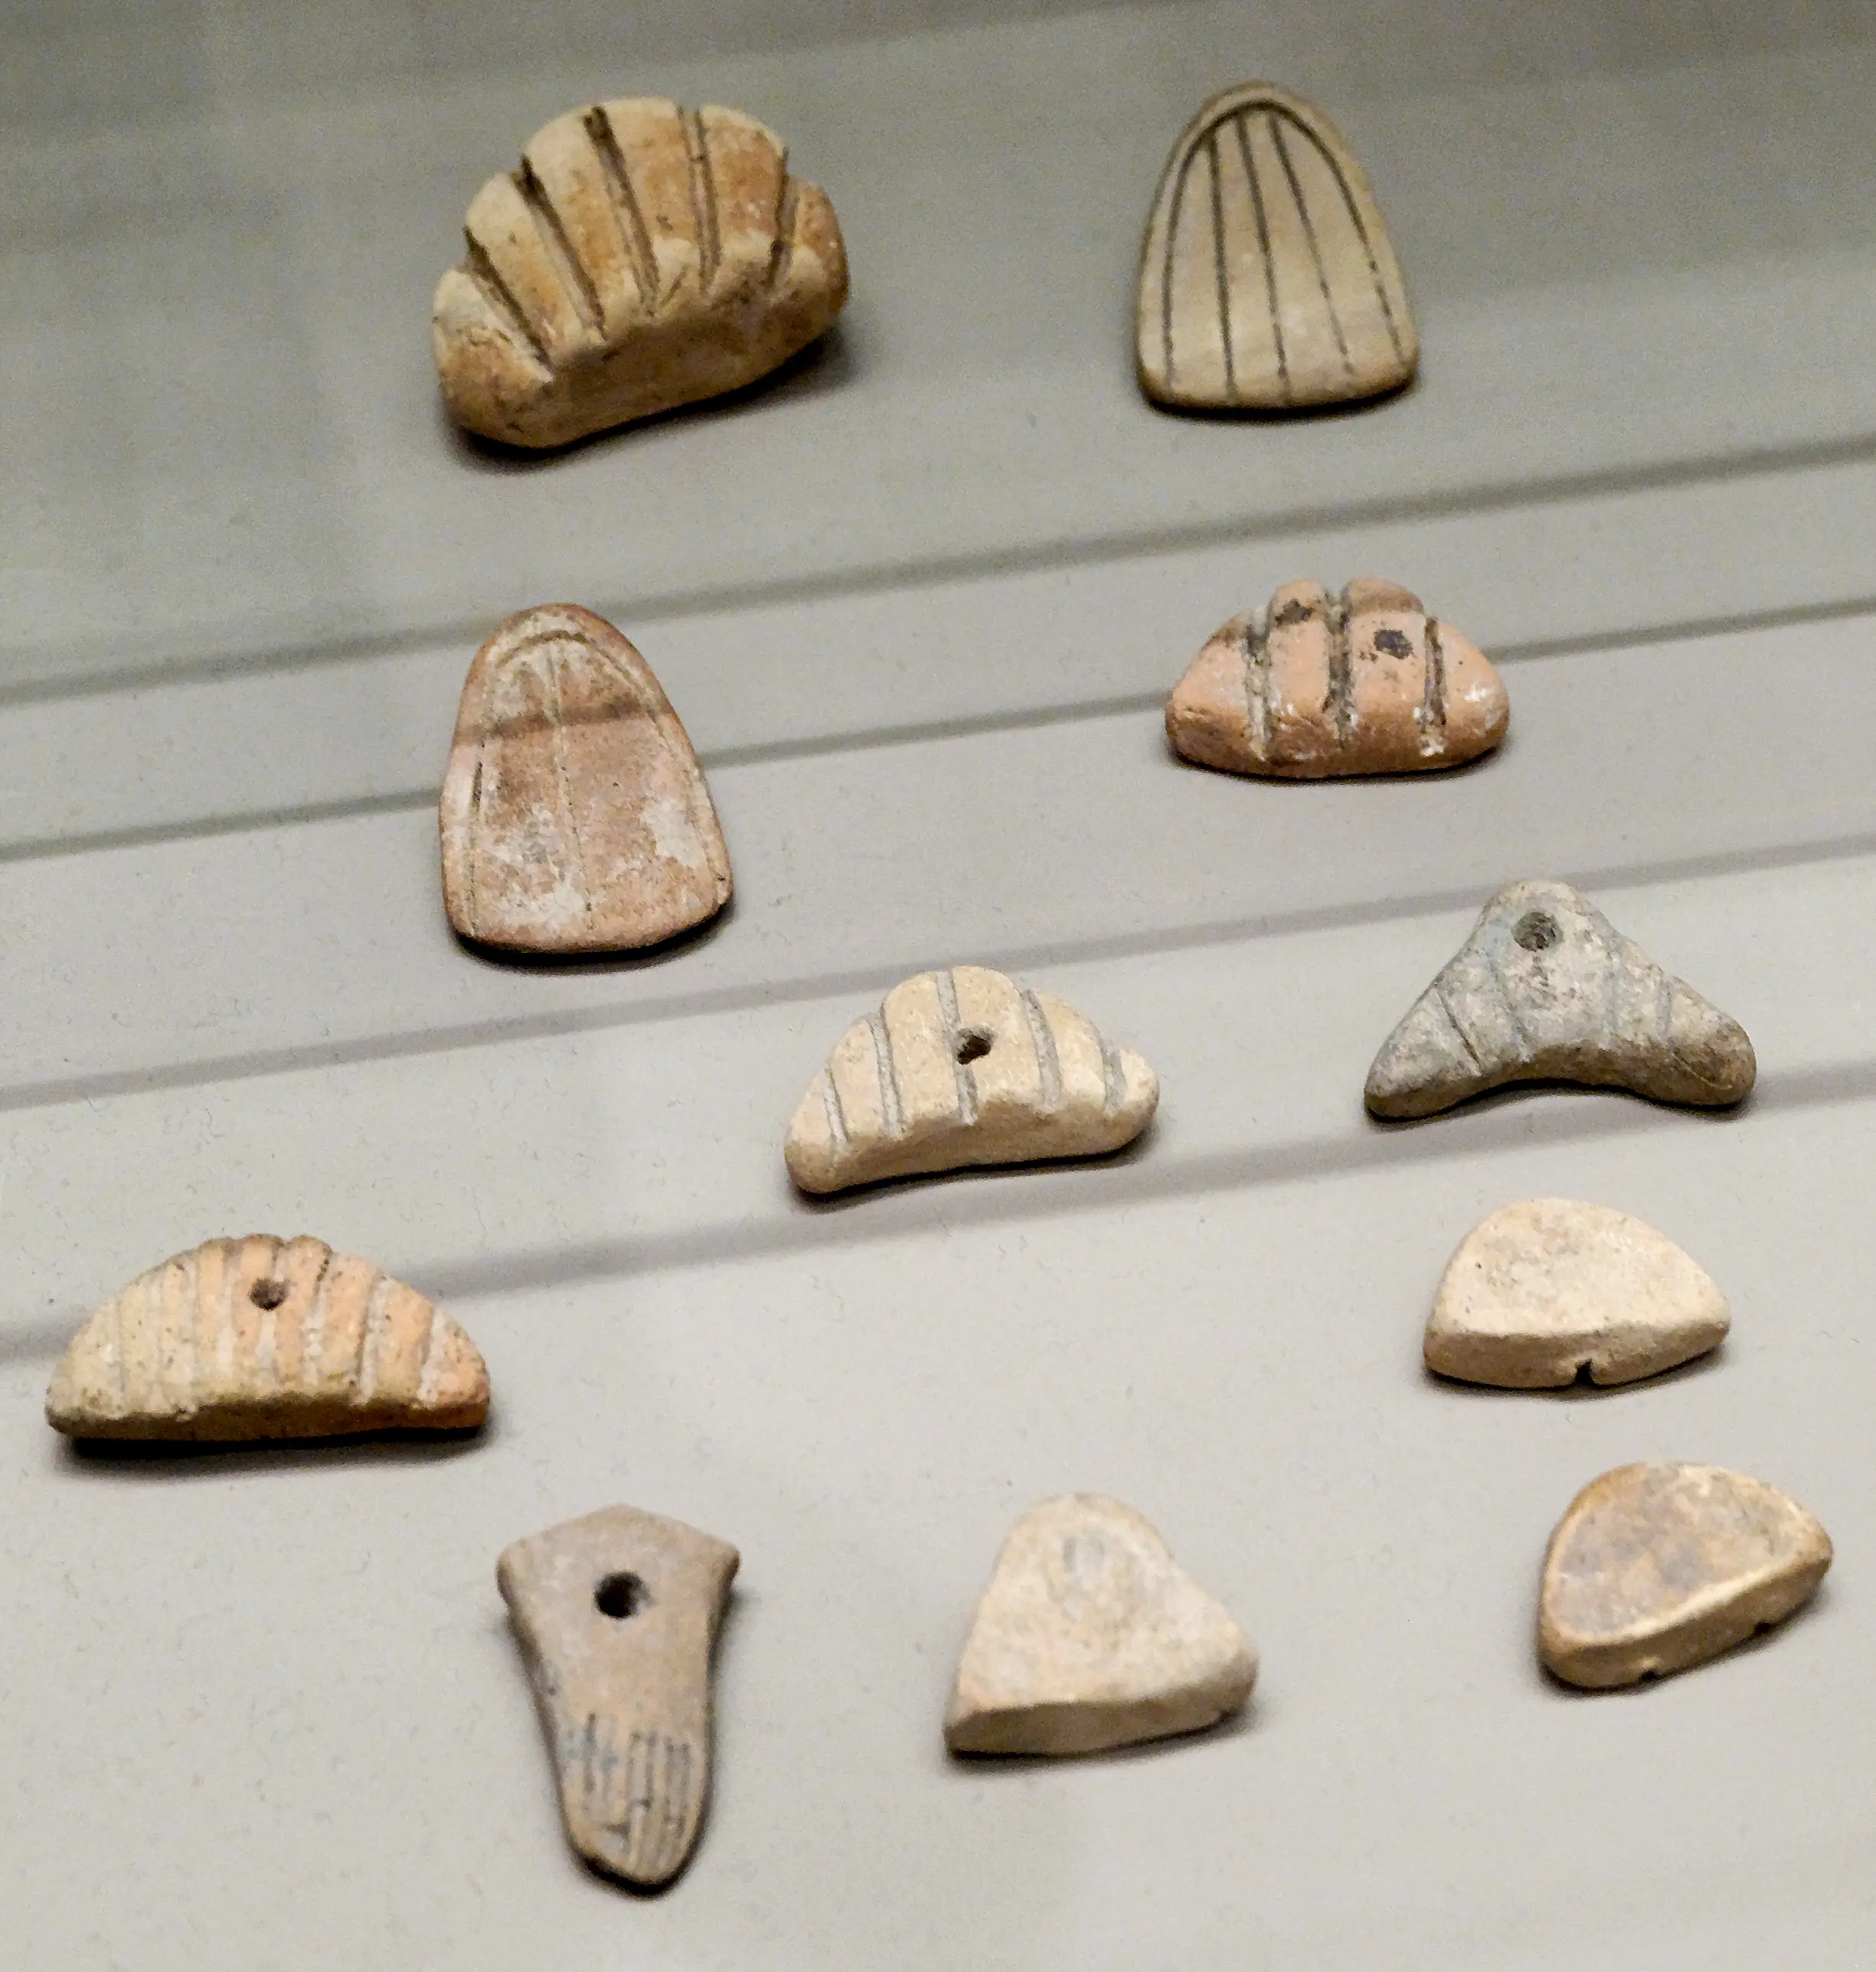
Clay tokens and bullae (Sumer, pre-3000 BCE), used as transaction records. Small tokens representing goods such as grain or sheep were sealed in hollow clay envelopes. This system provided the conceptual groundwork for abstract numeration and the invention of writing. Musée du Louvre, Iran antique 17403. Source
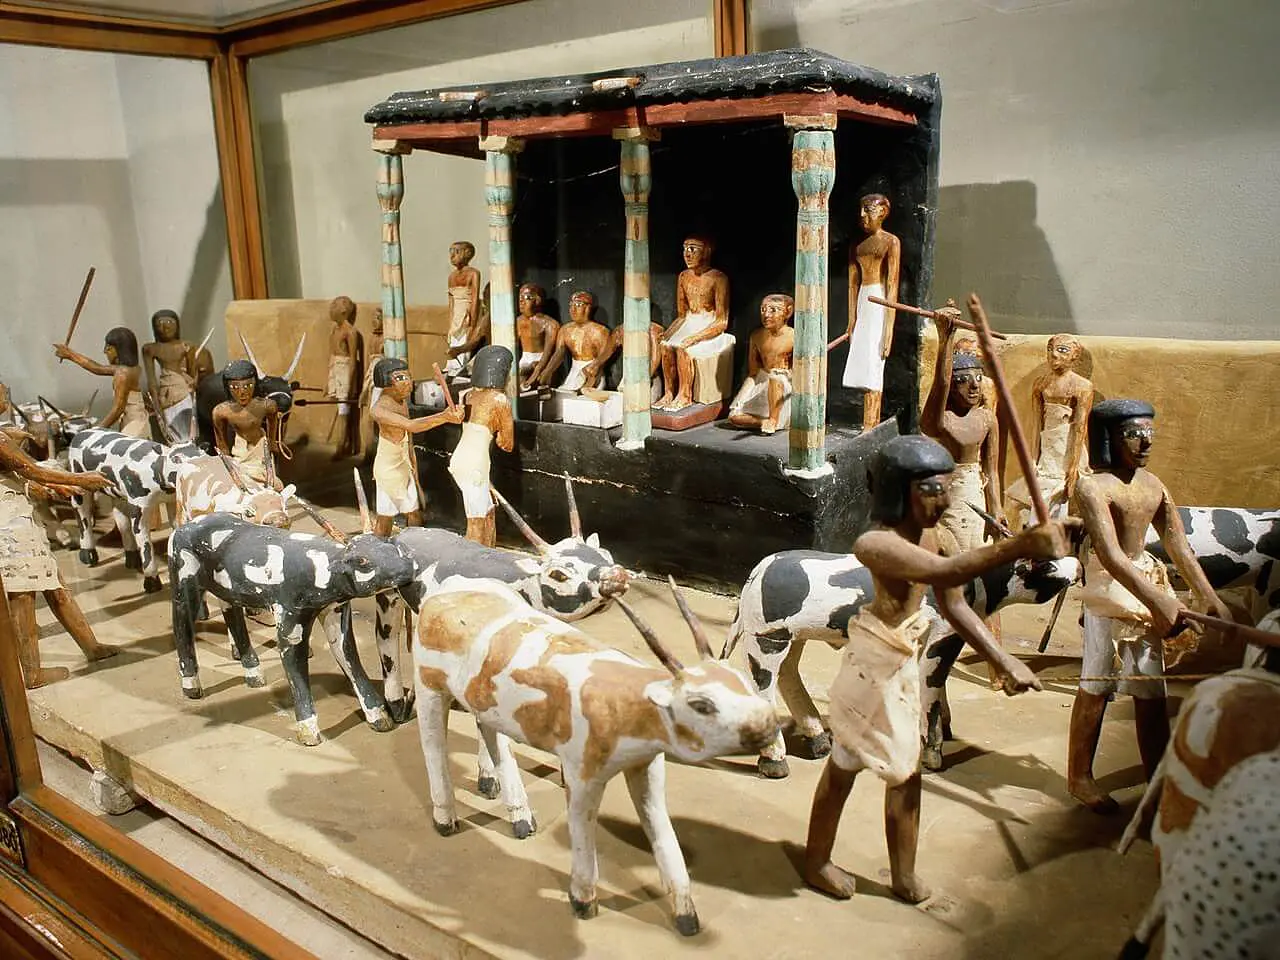
Model of cattle census (Egypt, 11th Dynasty). Wooden funerary model from the tomb of Meketre, showing scribes counting livestock. Such scenes were both documentary and magical, intended to ensure the eternal continuation of bureaucratic order and provisioning in the afterlife. Egyptian Museum, Cairo. Source.
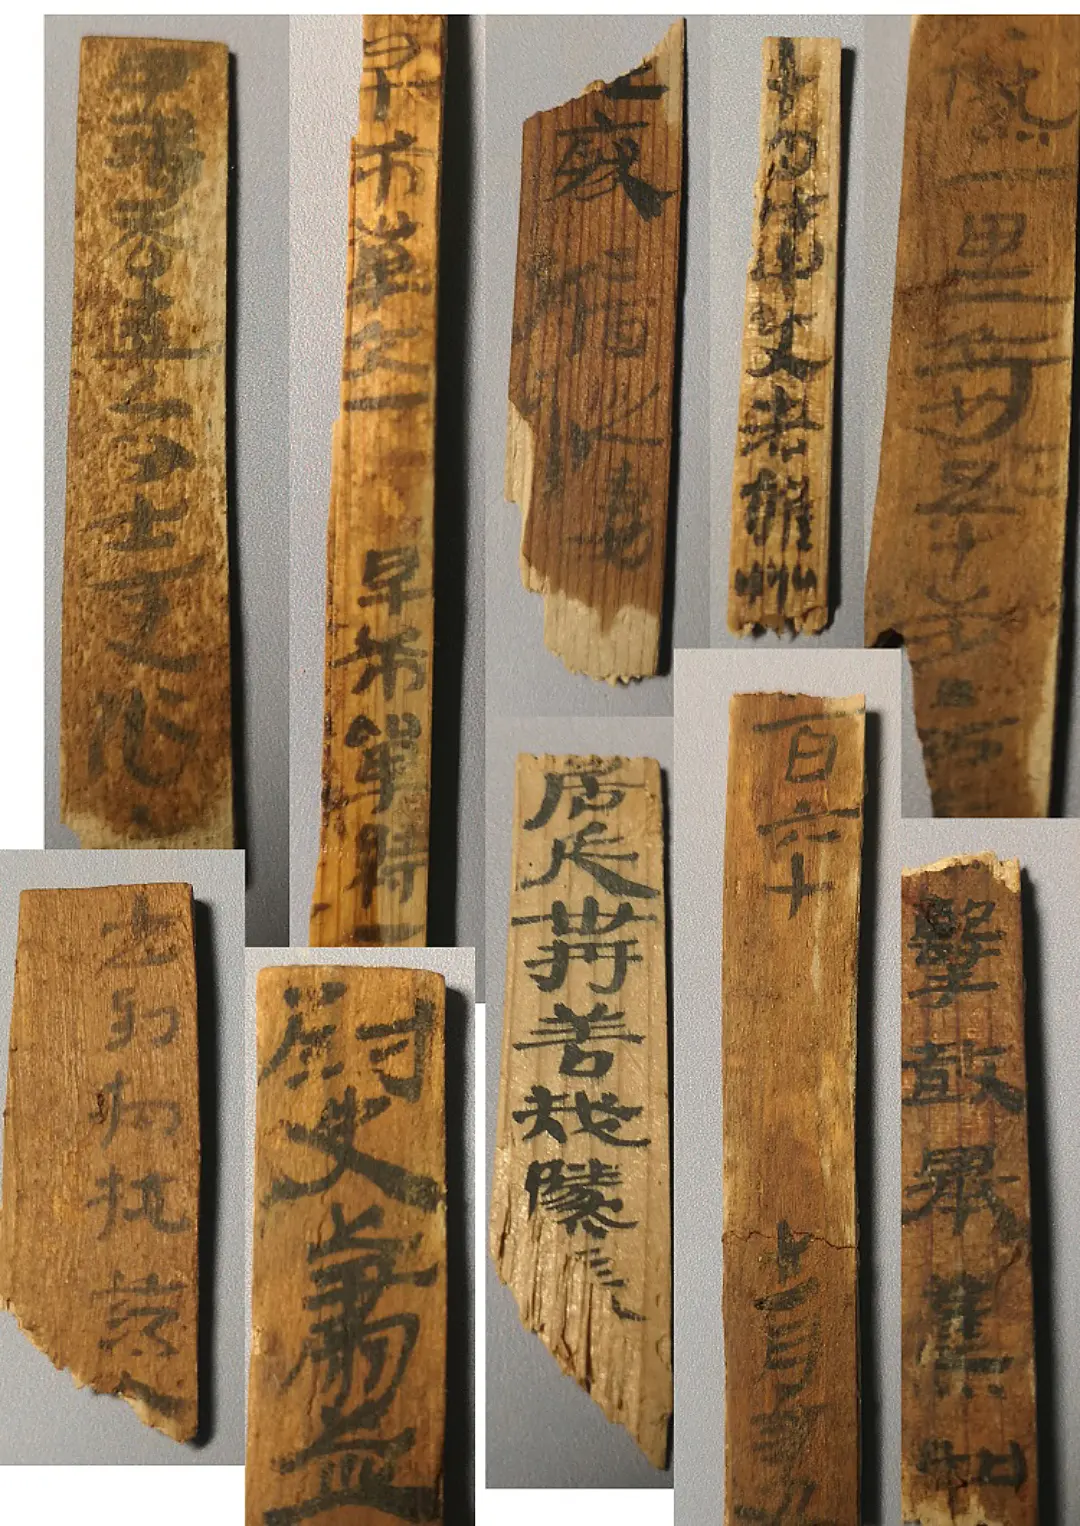
Han Dynasty administrative slips (China, c. 1st century CE). Strips of bamboo and wood bound into scrolls, used to record census figures, tax receipts, legal proceedings, and edicts. Though paper existed, these durable media defined early Chinese record-keeping at imperial scale. Ejine Banner Museum of Inner Mongolia. China Services Info
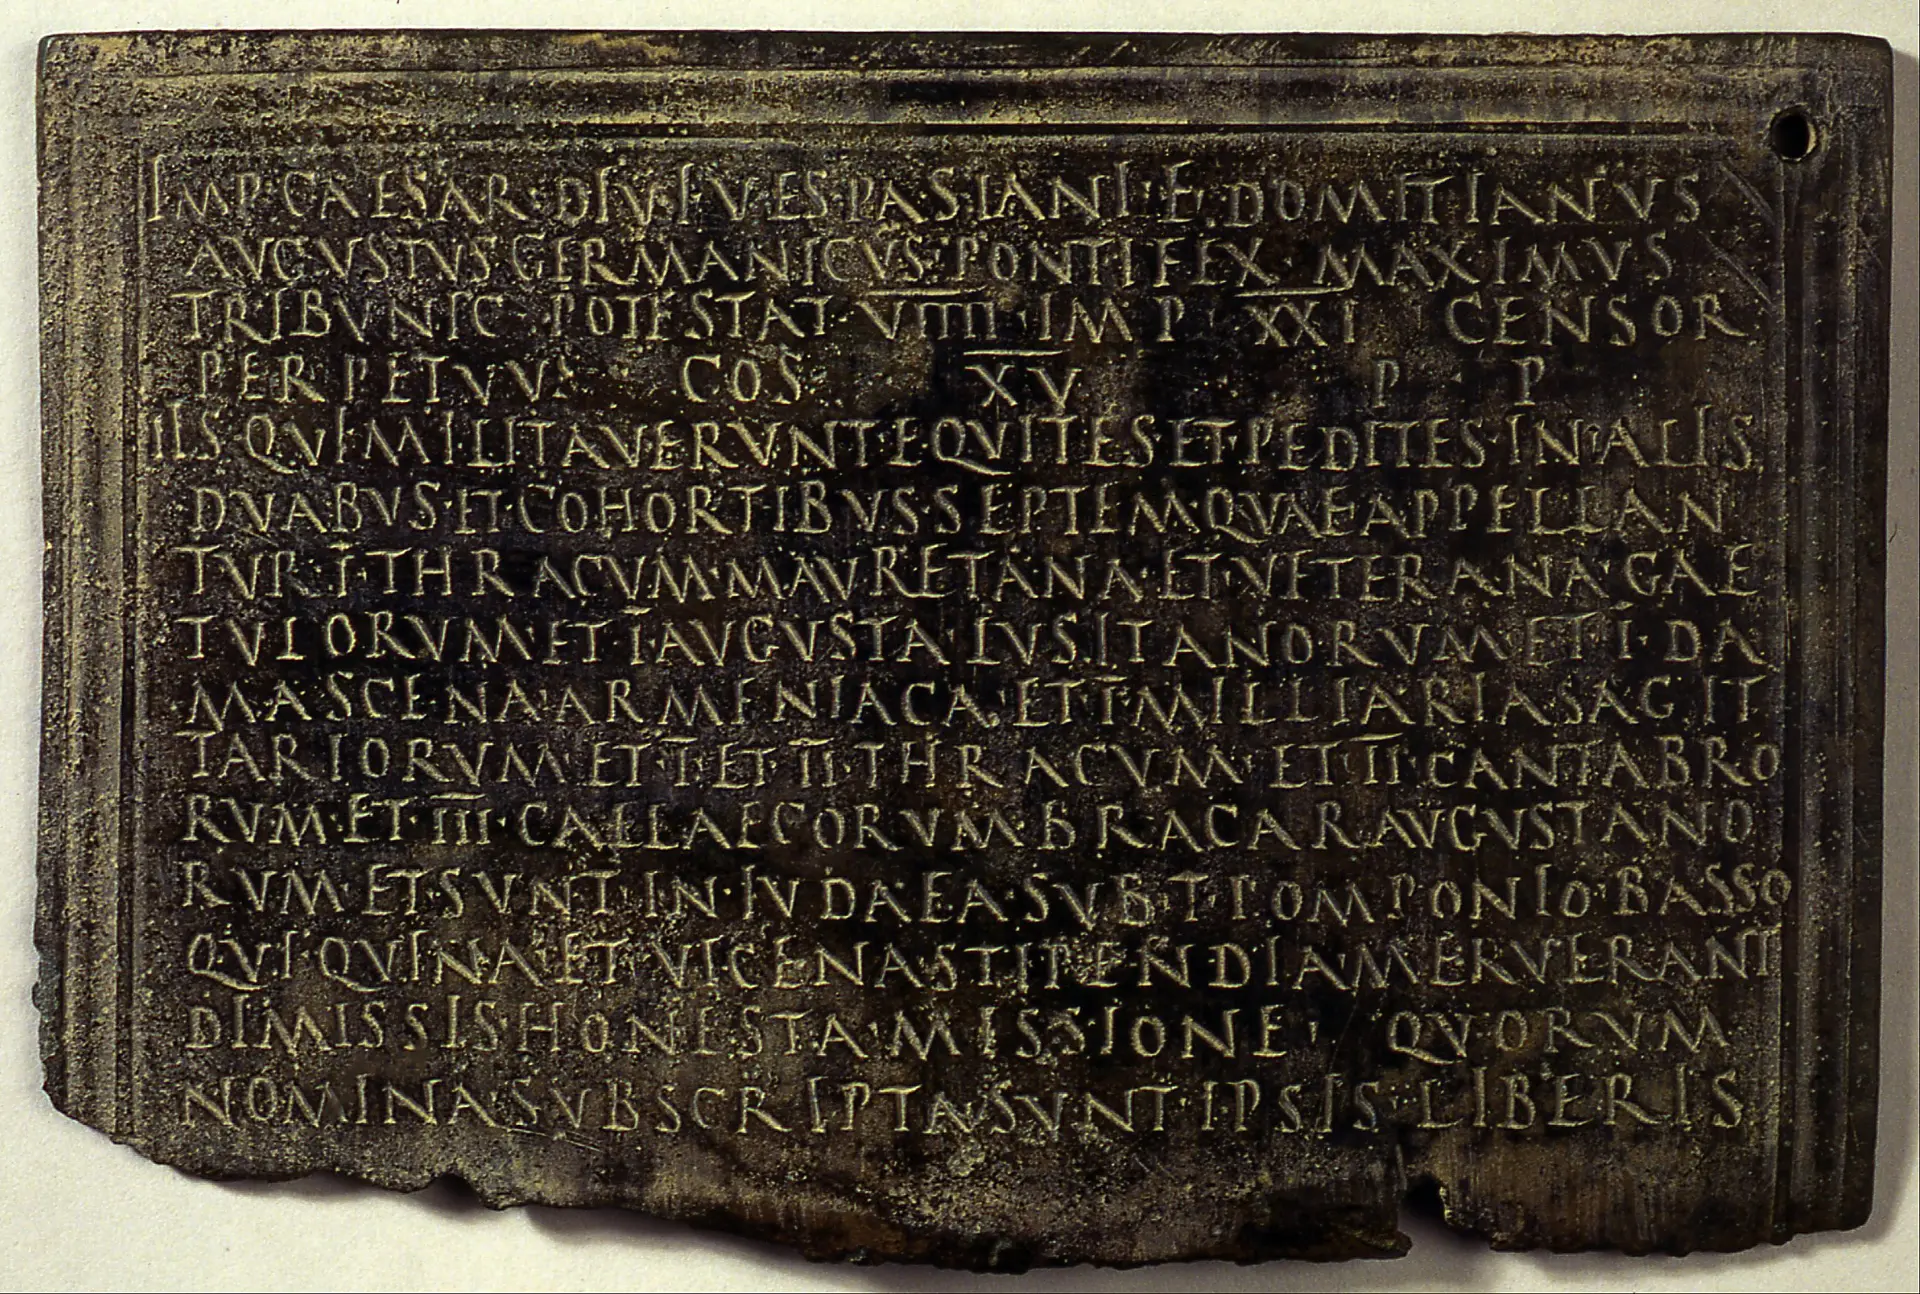
Roman military diploma (90 CE), cast in bronze. Granted citizenship and marriage rights to a discharged auxiliary soldier. Designed for durability and authenticity, such diplomas reflect Rome’s infrastructure for legal and identity verification across the empire. Israel Museum. Source
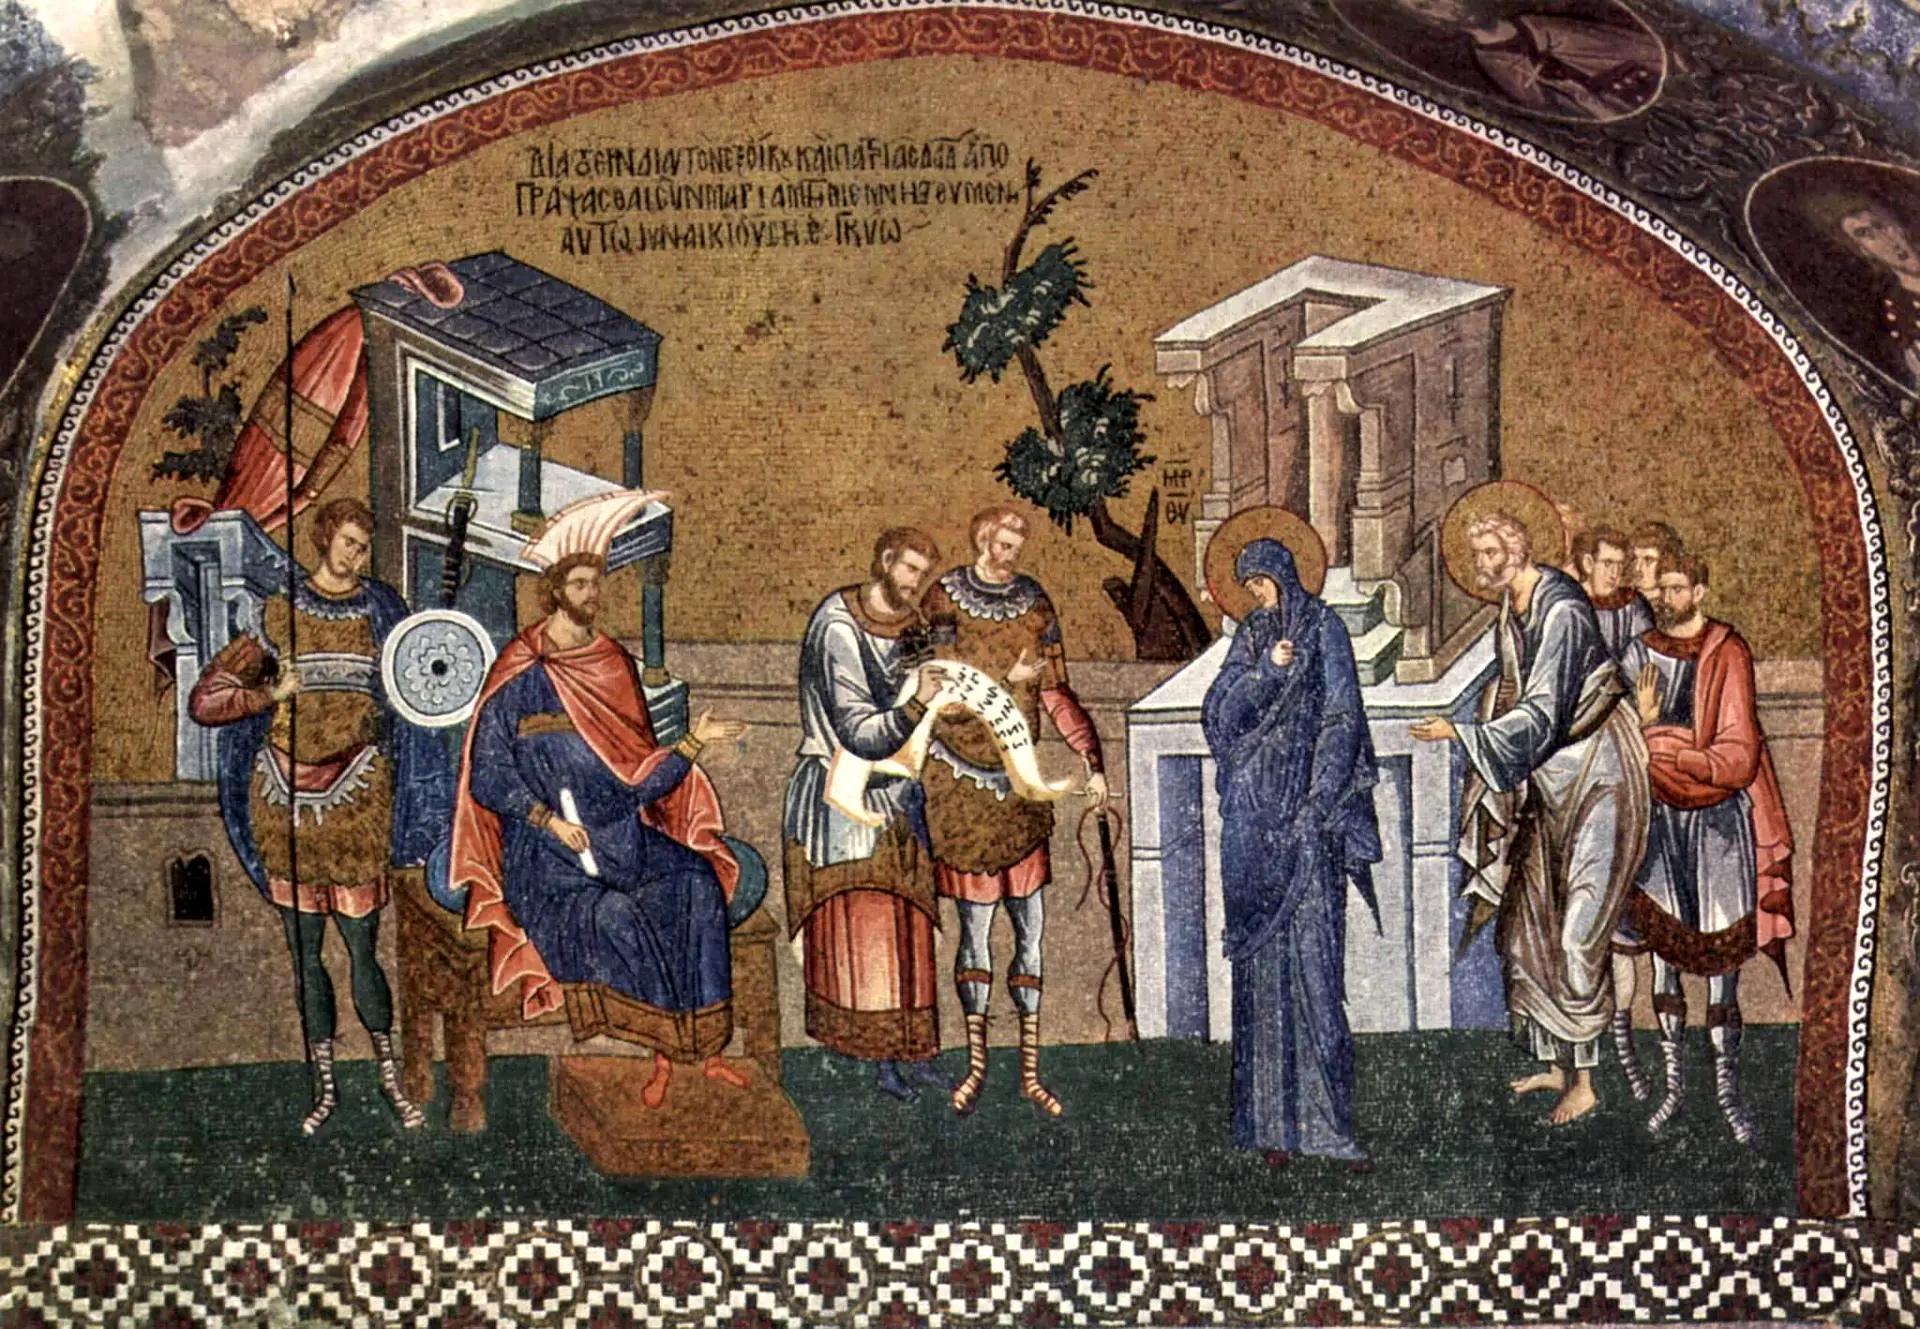
Census of Quirinius, mosaic (Istanbul, c. 14th century), Church of the Holy Saviour in Chora. Depicts the biblical census from the Gospel of Luke, enshrining Rome’s enumeration practices in religious memory. The scene links identity, taxation, and power, showing census as both ritual and registration. Source
In ancient Sumer, clay tokens evolved into cuneiform tablets to track grain, livestock, and labor — a direct response to the needs of temple economies. Egypt’s annual nilometer readings and population tallies shaped everything from taxation to cosmic order. In Imperial China, the household registration system (hukou) maintained dynastic stability. Rome’s census did more than record — it legitimized class, military duty, and political privilege.
A31_EARLY_ENUMERATION
A32_TABLES_GRAPHICS
Enumeration in ancient societies was more than a tally — it was a way to make order tangible. Counting grain or soldiers gave rulers proof of dominion, while censuses sanctified authority by linking earthly administration to cosmic or religious order. The key idea is that numbers here acted as instruments of power as much as records of fact. From this foundation, it was a short step to formats that didn’t just count but structured information — tabular thought.
A32_TABLES_GRAPHICS

Tabular Thought — From Gospels to Graphs
Tables were among the earliest tools used to organize and transmit information. In antiquity, cuneiform tablets managed inventories and taxes. By the 6th century CE, the Eusebian Canon Tables linked Gospel passages across the New Testament, facilitating theological study and laying the foundation for relational thinking.
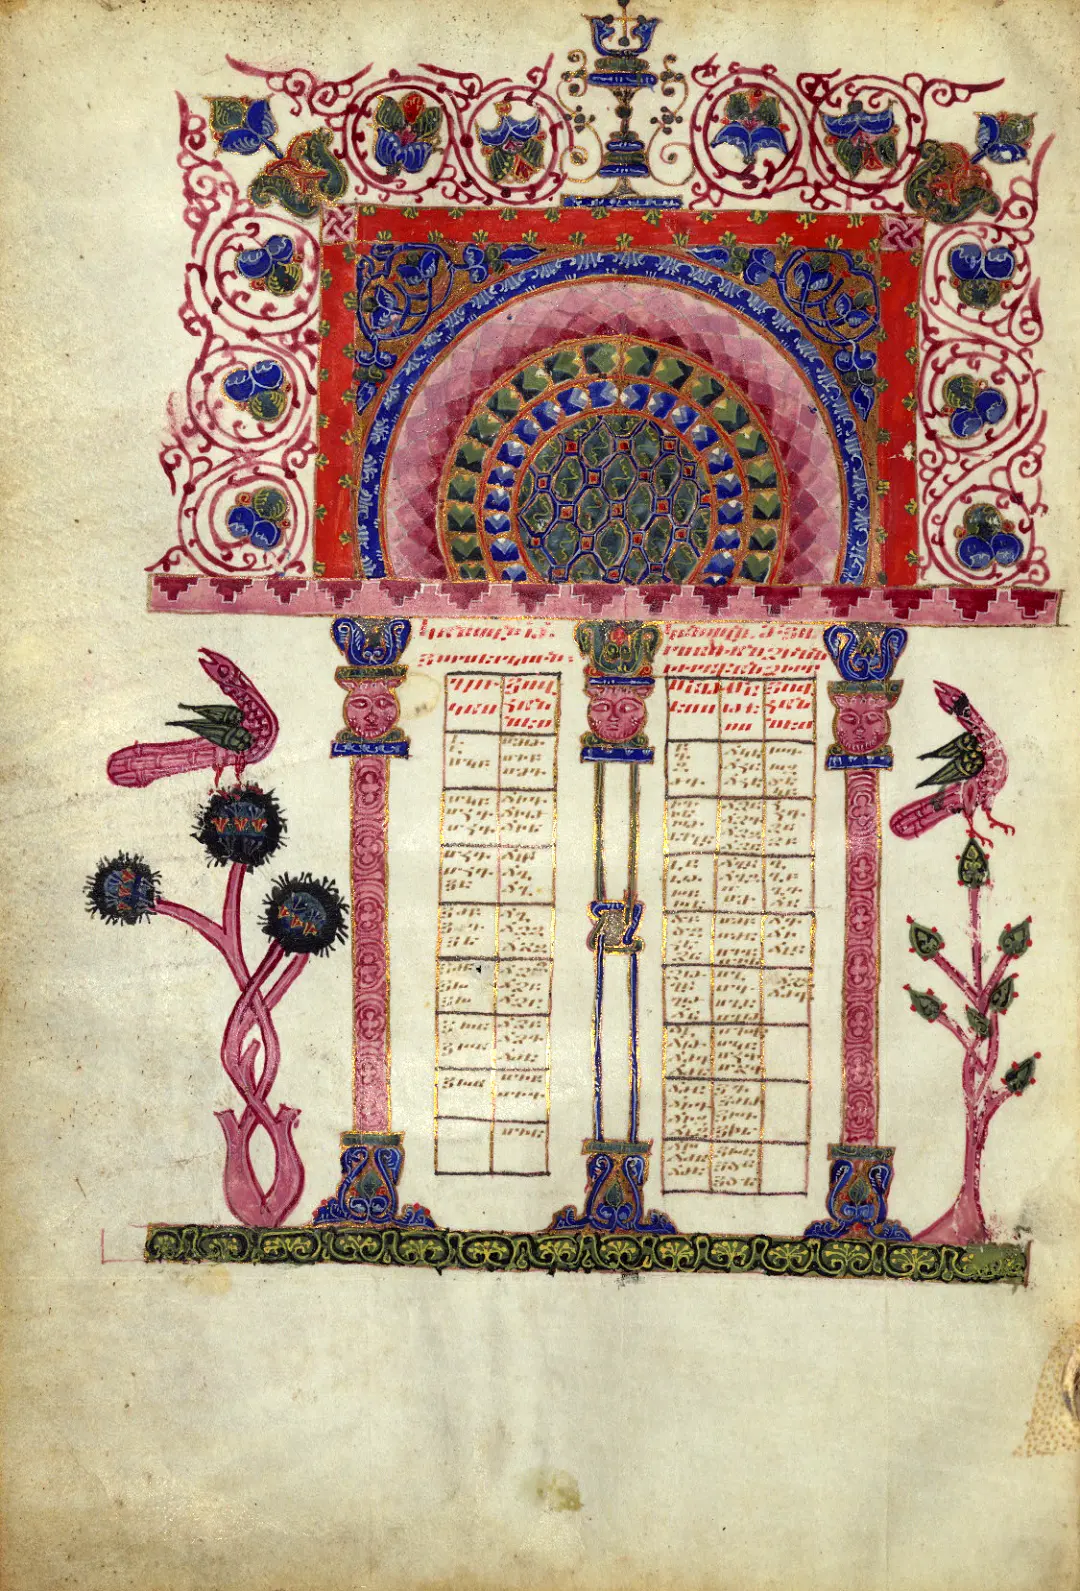
Eusebian canon tables from the Gospels, Armenian manuscript (12th century CE). A Christian adaptation of Hellenistic cross-referencing, these tables represent an early method for structuring complex information. Walters Manuscript W.538, fol. 10v. Source: The Walters Art Museum
Medieval Islamic scholars refined astronomical and mathematical tables, using them to convey empirical and calculated data. In Western Europe, tables were employed for liturgical purposes such as computing the Easter date, exemplified by Dionysius Exiguus's calendrical system in 532 CE.
By the 17th century, printed tables circulated widely, covering subjects from demographic counts to planetary motion, and provided a standardized format for organizing and comparing information.
A32_TABLES_GRAPHICS
A34_ECON_ABSTRACTION
Tables did more than arrange information. They trained readers to think in grids. By forcing data into rows and columns, tables created a structure that made comparison, correlation, and projection possible. This was processing on paper — a format that compressed complexity into manageable sequences and prepared the ground for more abstract models. The next step pushed this logic further, as political arithmetic turned lists and tables into diagrams of entire economies.
A34_ECON_ABSTRACTION

From Political Arithmetic to Economic Diagrams — Data Selection and Abstraction
Mathematical methods pushed economic data beyond counts and inventories. But the abstraction came with choices: what to count, what to ignore, and how to draw a system where labor and material resistance disappeared.
This was no longer about describing society, but simulating it. Graphs of cost and output treated work as a function, not a force. The body vanished. Diagrams circulated through ministries and lecture halls, presenting a world of perfect inputs and optimized exchange.
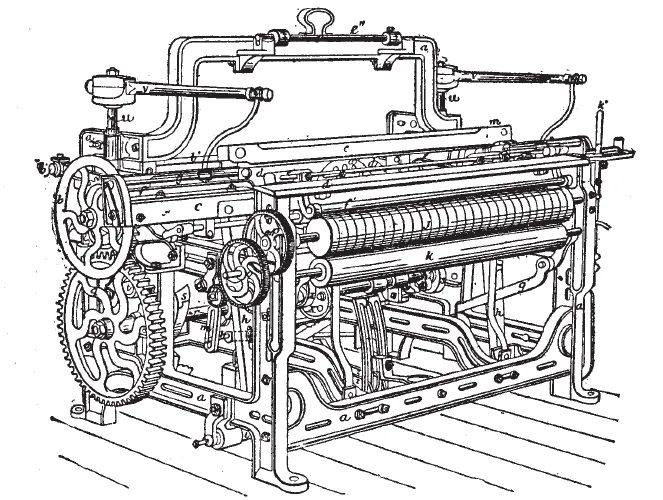
Lancashire power loom from Richard Cotton Marsden’s “Weaving: Its Development, Principles, and Practice” (1895). English looms like this dramatically increased textile productivity while displacing skilled handweavers across the countryside. Source
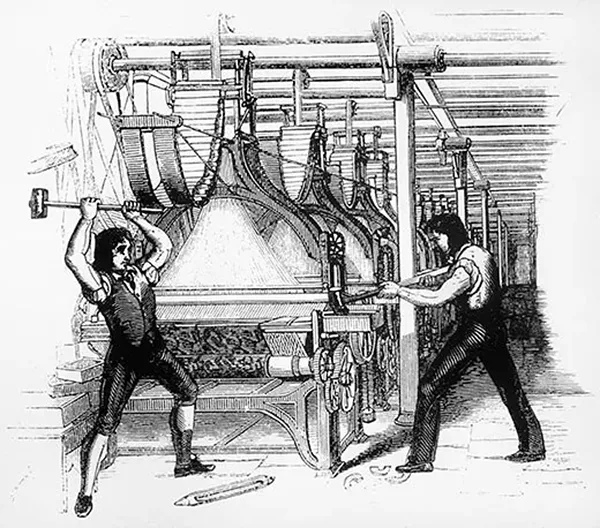
Luddite resistance, engraving by unknown author (early 19th century). The uprisings of the 1810s were less a rejection of technology than a revolt against the erosion of skill, autonomy, and fair wages under early factory regimes. Smithsonian Magazine
In this shift, the loom returned — not as a machine, but as a metaphor. Economic modeling borrowed its logic: patterns encoded, complexity reduced, skill displaced. And just as mechanical looms once triggered uprisings among artisans, this new epistemic loom — operated by economists — restructured the world with invisible consequences.
A34_ECON_ABSTRACTION
A35_HYDRAULIC_ECONOMY
By the late 19th century, economists increasingly worked with diagrams, curves, and abstract models to represent flows of goods and behaviors of markets. These visualizations did not just display numbers but organized them into systems, turning production, cost, and exchange into patterns that could be manipulated and compared. Such models helped shift economic reasoning from descriptive accounts to formalized structures of analysis.
A35_HYDRAULIC_ECONOMY

Liquid Models — Simulating Economies with Analog Machines
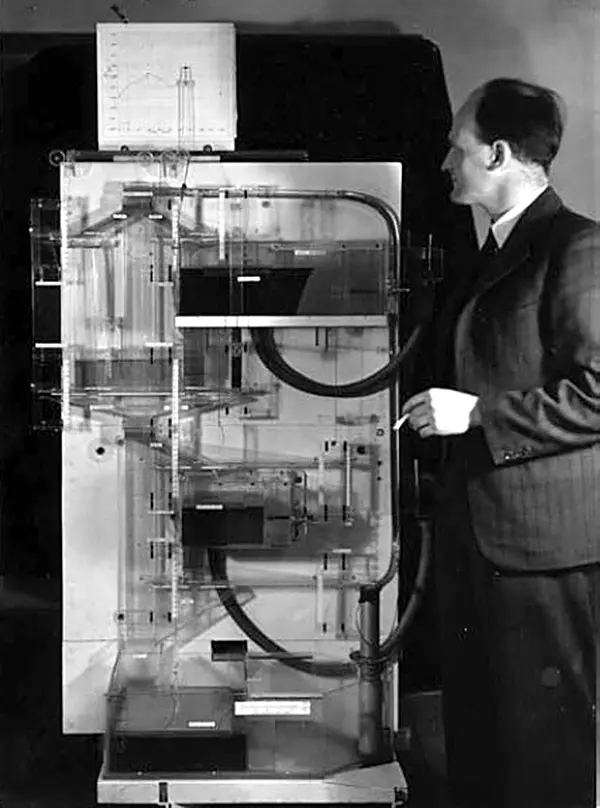
While Herman Hollerith’s punch-card systems became the foundation of administrative computing, other thinkers explored more physical metaphors for modeling economic systems. In 1891, economist Irving Fisher built a hydraulic machine to simulate general equilibrium using interconnected tubes and flowing water. By adjusting valves and fluid levels, users could visualize supply, demand, and price dynamics across markets.
This idea didn’t end there. In 1949, Bill Phillips, a New Zealand economist and engineer, built the MONIAC — a larger hydraulic computer that modeled national income flows, taxes, investments, and savings using colored water in tanks and pipes. It became a teaching and policy tool, particularly in postwar Britain.
Irving Fisher’s hydraulic machine (1891). A pioneering attempt to simulate market equilibrium, using water to model flows of supply and demand. Conversable Economist
The MONIAC, built by Bill Phillips (1949). An analog computer using tanks and pumps to demonstrate Keynesian economics. Conversable Economist
These analog machines never reached administrative scale. But they represented an alternative path: computation through embodied simulation rather than abstraction. Their legacy is conceptual — a reminder that the urge to visualize systems long predated digital spreadsheets, and that data modeling once flowed, quite literally, through pipes.
A4
Business Data and Tabulation
By the early 20th century, the abstractions of economists and statisticians were mirrored by the spread of mechanical tools for everyday business. Cash registers, adding machines, and tabulators no longer modeled economies in principle — they processed transactions, wages, and inventories in practice.
Data processing now entered offices, banks, and shops. Reliability and speed mattered as much as theory. Machines hardened routines into mechanisms, ensuring that calculation, accounting, and reporting could happen without delay or dispute. This shift marked the move from experimental models to practical infrastructures of commerce and industry.
A42_BUSINESS_INTELLIGENCE

Early Business Intelligence — From Intuition to Data
Sir Henry Furnese, who founded the Bank of England in 1694, was among the first merchants to build espionage networks, gathering reports from across Europe on military, political, and trade affairs. His ability to anticipate market shifts through such information marked an early form of business intelligence, moving commerce from instinctual decision-making toward data-driven speculation.
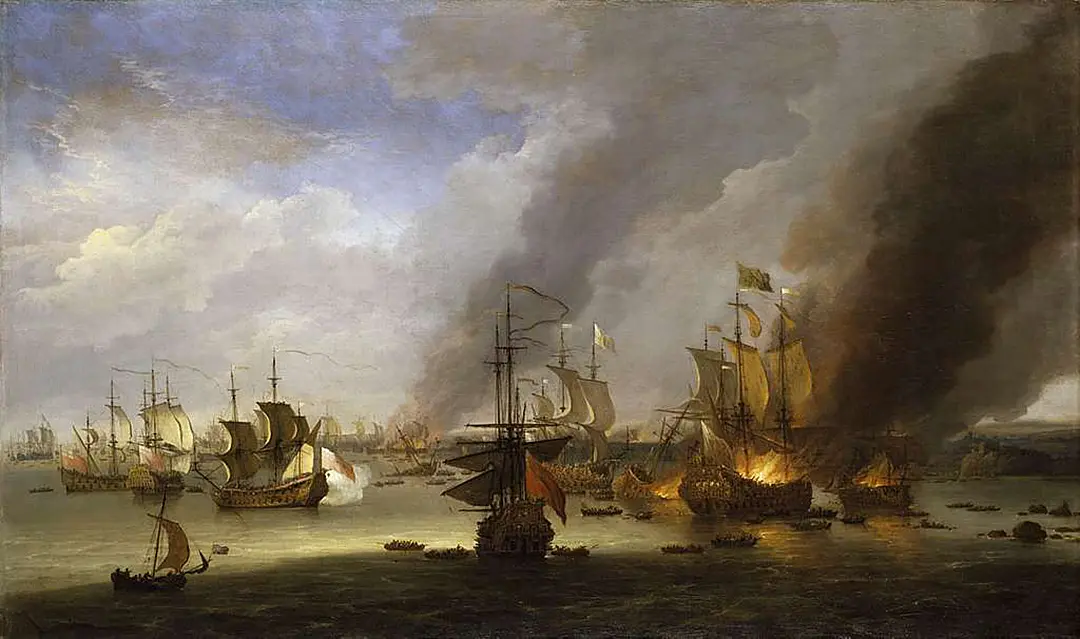
Adriaen van Diest, “Destruction of the Soleil Royal at the Battle of La Hogue” (1692). This pivotal event in the Nine Years’ War shaped European political and military outcomes and influenced emerging financial systems. The Bank of England, mentioned earlier, was founded to fund this conflict. Source: Royal Museum Greenwich
With the rise of industrial capitalism, businessmen sought more formalized, empirical ways to manage complexity. In the 1880s, engineer Frederick Winslow Taylor developed time-and-motion studies to measure labor productivity. His data-driven insights redefined managerial decision-making.
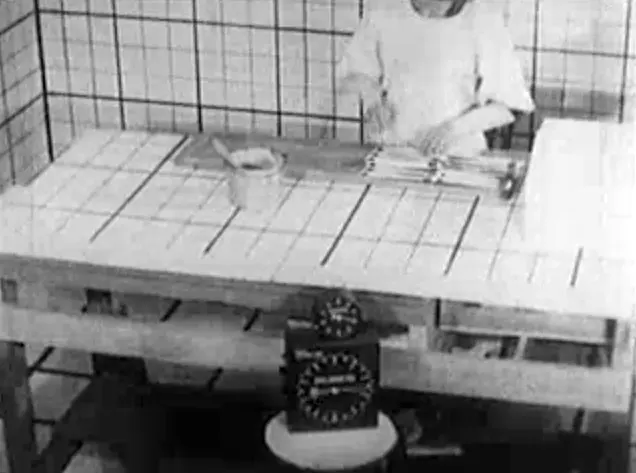
Film still from a pioneering study by Lillian Gilbreth and Ralph Barnes (1910–1924). Using motion-picture analysis to record factory tasks, they developed motion study techniques that advanced systematic approaches to business intelligence and laid foundations for data-driven management in early 20th-century industry. Source: Archive.org
In the early 20th century, the pioneering films by Lillian Gilbreth and Ralph Barnes, investigating industrial operations and developing motion study techniques (1910-1924), further advanced the systematic approach to business intelligence. Their work laid the foundation for the growing use of data to streamline operations and decision-making.
Soon after, Henry Ford adapted such techniques to refine production lines, timing the manufacture of each component and embedding measurement into industrial practice.
A42_BUSINESS_INTELLIGENCE
A43_GRAPHIC_STATS
What these practices revealed was a deeper shift in the culture of decision-making. Business leaders demanded evidence that could be logged, compared, and replicated. Data became an active instrument, not a by-product — something managers could wield to control processes and outpace rivals.
This new expectation set the stage for another leap: turning numbers into convincing images.
A43_GRAPHIC_STATS

Visualizing Society — Finance, Mortality, and Governance
As statistical thinking matured, so did methods to visualize it. By the 17th century, England’s Bills of Mortality were not only collected but interpreted. John Graunt’s 1662 analysis offered early demographic insights, tracking plague deaths and life expectancy. A few decades later, Edmund Halley’s mortality tables laid the foundation for actuarial science.
In the 19th century, the use of charts and graphs became more systematic. William Playfair’s bar and pie charts helped represent trade balances and budgets. In the U.S., business statisticians embraced infographics to guide decision-making.
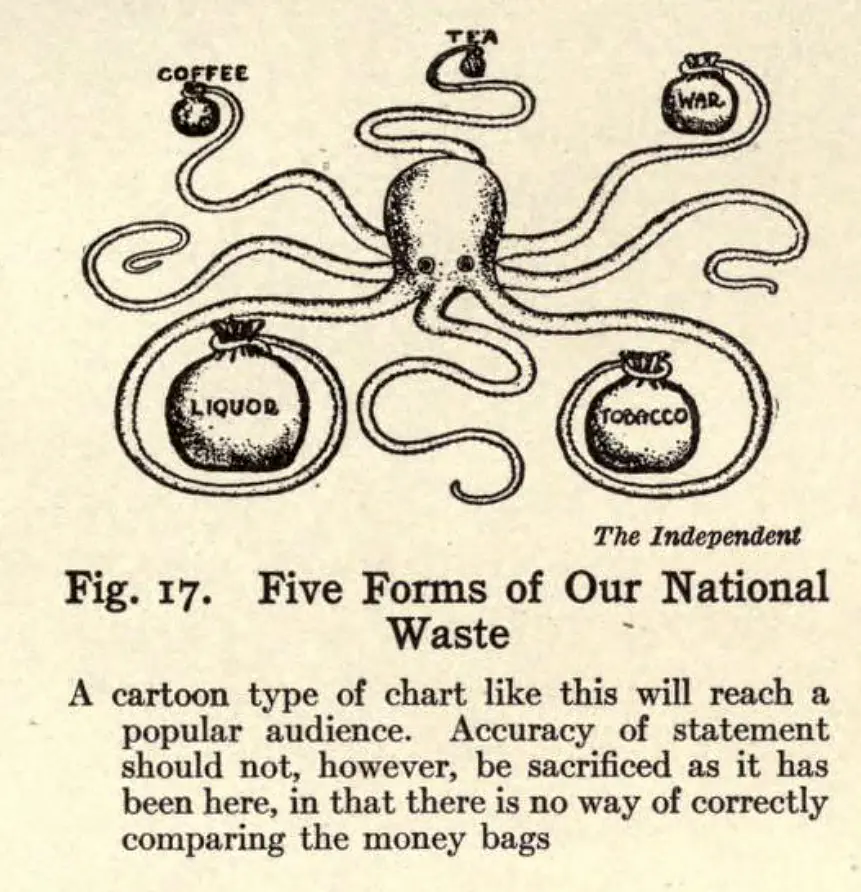
Illustration from Willard Brinton’s “Graphic Methods for Presenting Facts” (1914), using the octopus metaphor to depict the complexity and interconnectedness of data. Source: Archive.org
Willard Brinton’s Graphic Methods for Presenting Facts (1914) emphasized that clear representation could shape executive understanding. His manual ranged from simplified charts to complex 3D diagrams, promoting visuals as practical tools for business and government.
A43_GRAPHIC_STATS
A44_MECHANICAL_ENTRY
Visual representation revealed that numbers alone could not persuade. Turning data into images transformed abstraction into patterns that could be grasped quickly and acted upon. Graphs and charts compressed complexity into forms that executives, administrators, and citizens could read at a glance.
Processing here was not only about calculation but about communication, making information usable across institutions. The next frontier took this logic further, embedding calculation directly into machines that recorded transactions and mechanized the ledger.
A44_MECHANICAL_ENTRY

From Cash Registers to Calculators — Mechanizing the Ledger
The industrial push to mechanize business records brought calculating devices out of labs and into the workplace. In 1879, Ohio saloon owner James Ritty and inventor John Birch patented the “incorruptible cashier,” a mechanical register designed to prevent employee fraud.
Models were soon enhanced with paper rolls for printed receipts, turning cash registers into trusted tools for recording financial transactions. This innovation led to the founding of companies like Burroughs and National Cash Register, which later pivoted into the computing industry.
Meanwhile, Swedish engineer Willgodt T. Odhner, working in St. Petersburg (Russian Empire), developed a compact mechanical arithmometer in the 1870s. His device, refined over decades, became a standard in Soviet administrations and was marketed in the West under the “Facit” brand.
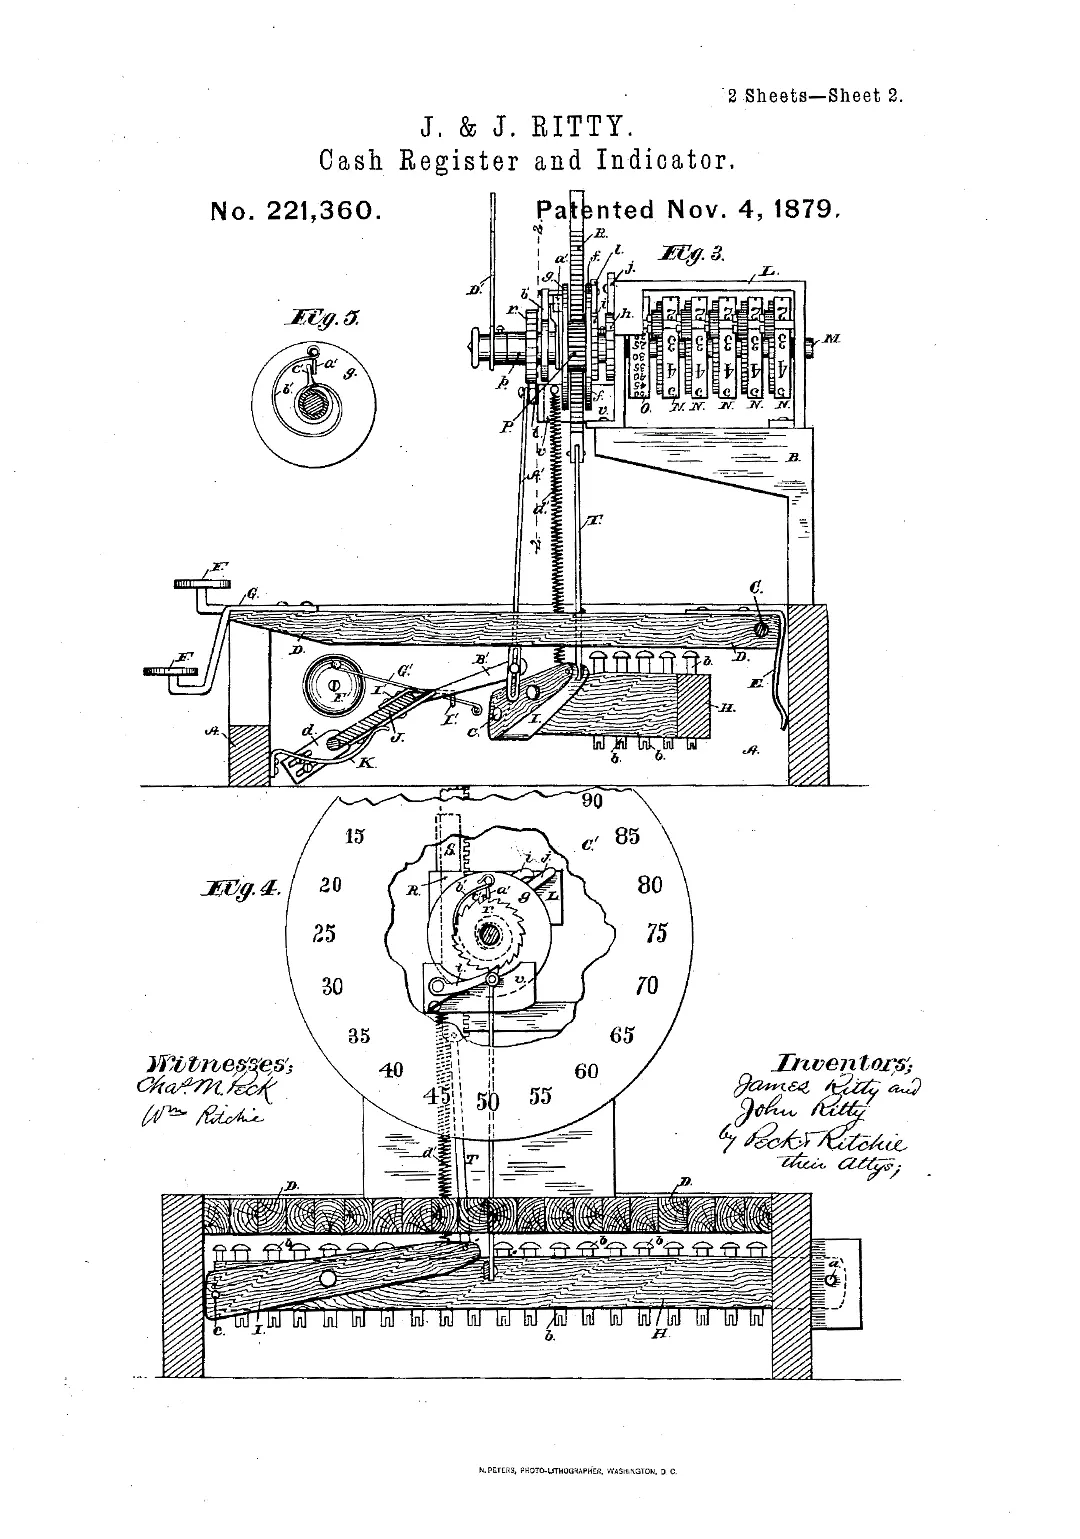
Blueprint of the cash register and indicator from U.S. Patent No. 221360, filed by James and John Ritty on November 4, 1879. Google Patents
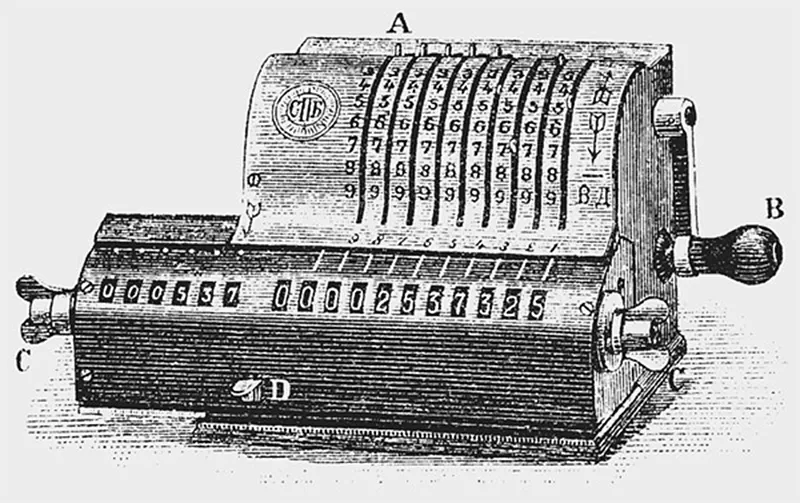
Illustration of Odhner’s arithmometer from the magazine “Science and Life” (Nauka i zhizn), No. 45 (1890). Life and Science
A44_MECHANICAL_ENTRY
A45_TABULATOR_COMMERCE
Cash registers and arithmometers did more than speed up transactions. They redefined how information was captured and trusted, standardizing entries into receipts and ledgers that machines could process.
With key-driven inputs, calculation became a mechanical routine rather than a mental task. This was the first real interface between everyday business and computational logic, preparing the ground for tabulators that would extend the same principles across entire industries.
A45_TABULATOR_COMMERCE

Tabulating Commerce — Insurance, Railroads, and Beyond
In 1890, Herman Hollerith demonstrated his punch card tabulator to the Actuarial Society of America, marking a pivotal moment in the adoption of data-driven decision-making in business. Insurance companies like Prudential quickly saw the potential and adopted the system to streamline claims processing, though some actuaries, including John K. Gore, developed faster alternatives to Hollerith’s machines.
By 1910, Hollerith’s tabulator was being used by British railways to monitor costs and revenue per locomotive, linking granular data to profit margins. As Hollerith’s company evolved into IBM, the technology spread into European transportation networks — in 1928, Ferrovie dello Stato in Italy began using IBM equipment to manage train schedules and spare parts.
 A45_TABULATOR_COMMERCE
Supercluster B
Tabulators enabled a deeper understanding of organizations by breaking down revenue, costs, and claims with a precision no clerk could match. Processing here meant seeing patterns inside companies as clearly as governments had begun to see them in populations. From this point forward, data was deliberately mined for advantage.
***
Processing data was never only about machines. It grew out of habits and formats that shaped how societies worked. Counting, tabulating, and recording made information durable and transportable. Tables, punch cards, and ledgers imposed order, turning scattered facts into sequences that could be compared, recombined, and acted upon.
Mechanical registers, calculators, and tabulators embedded processing into shops, offices, and corporations. What had once been ritual or spectacle had become infrastructure, preparing the ground for electronic systems.
The Database Before Databases — Scale, Standardization, and Control
The mid-20th century brought a rupture in scale. Expanding states and corporations produced torrents of information that no manual routines could absorb.
It was like a loom suddenly overwhelmed with threads spilling in every direction. New machines had to take over, not as mechanical aids but as electronic systems able to hold entire fabrics of records together.
UNIVAC and its successors arrived in this moment — not as incremental upgrades, but as wagers that the basic functions of society could be entrusted to digital logic.
B1
UNIVAC — From Machine to Metaphor
What made UNIVAC distinct was the combination of scale and symbolism. It was a commercial object priced in millions, yet also a cultural emblem that made electronic data processing visible to the wider public. UNIVAC pointed toward futures in which records, statistics, and planning would be managed by logic circuits rather than clerks.
B11_UNIVAC

UNIVAC I — Betting on Electronic Processing
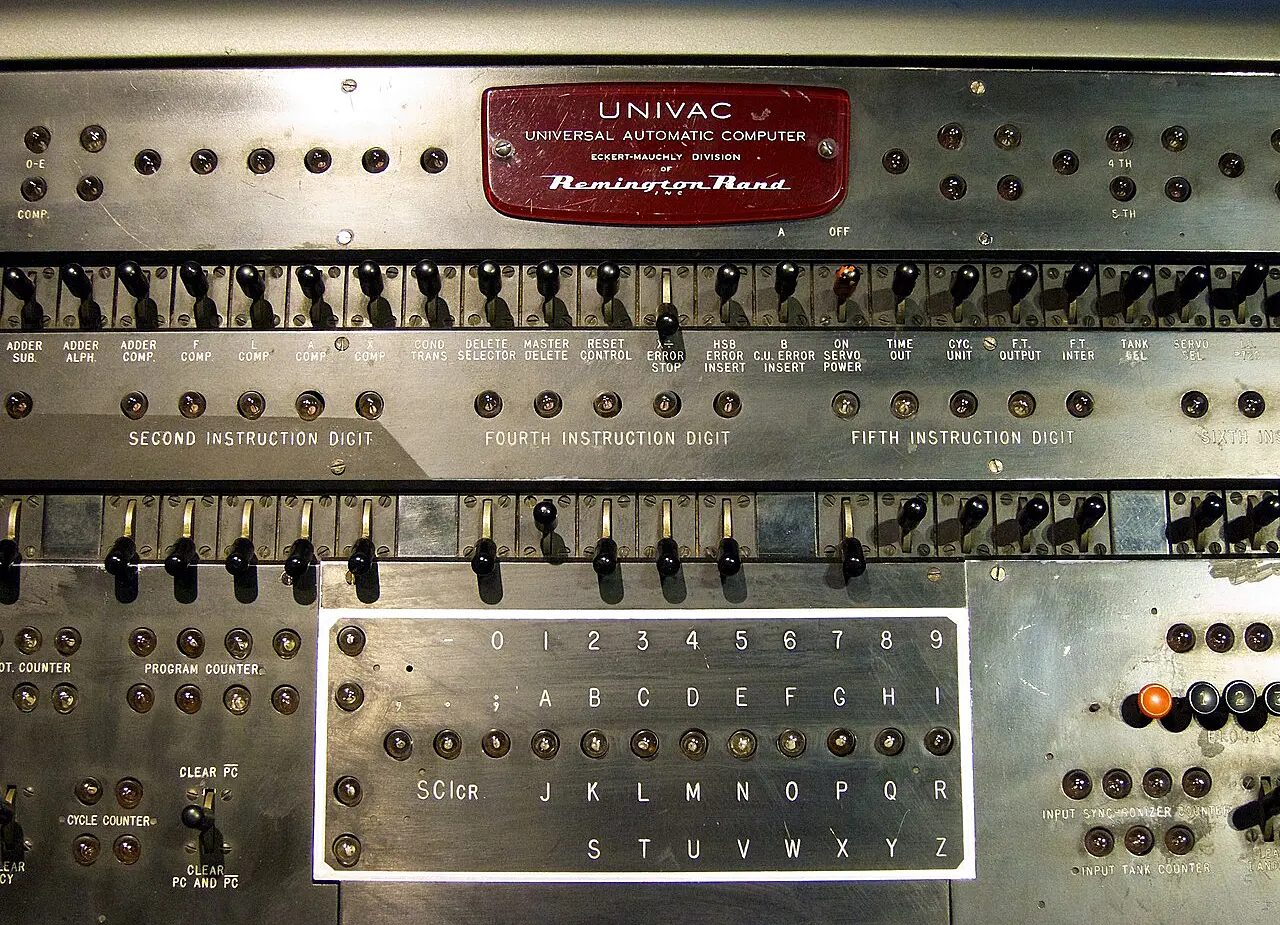
UNIVAC central panel, used by operators to control programs and monitor machine status through switches and indicator lights. Photo by Don DeBold. Source
The UNIVAC I (Universal Automatic Computer I), introduced in 1951, was the first digital computer designed for commercial use in the United States. It was a room-sized system powered by thousands of vacuum tubes, using magnetic tape drives along with punch cards. UNIVAC could execute approximately 1,905 operations per second, and it employed mercury delay line memory capable of storing 1,000 words of 12 characters each.
This hardware allowed UNIVAC to handle both numeric and alphabetic data at unprecedented speeds for its time. It was programmable, universal in purpose, and significantly outpaced earlier mechanical and electromechanical systems.
The machine sold for between $1.25 and $1.5 million, which limited its potential to spread across industries. But its cultural impact was such that it quickly became a symbol of the new era of machine-powered thinking.
B11_UNIVAC
B12_UNIVAC_CENSUS_GE
Purchasing UNIVAC was a gamble as much as an investment. At more than a million dollars and with no proven market, the machine asked its buyers to take a leap of faith in electronic processing. This wasn’t about chasing marginal efficiency — it was about entrusting entire record systems to circuits and tape.
That choice carried symbolic weight: in placing confidence in a black box of logic, institutions declared that data itself could be managed by machines. The wager would be tested immediately in practice, beginning with the U.S. Census Bureau.
B12_UNIVAC_CENSUS_GE
UNIVAC in Practice — From Census to Payroll
UNIVAC’s debut wasn’t in theory — it was in practice. The U.S. Census Bureau became the first non-military, non-academic institution to operate an electronic digital computer. The agency used it to tabulate census data, performing large-scale record matching and statistical analysis that would have taken human clerks weeks or months.
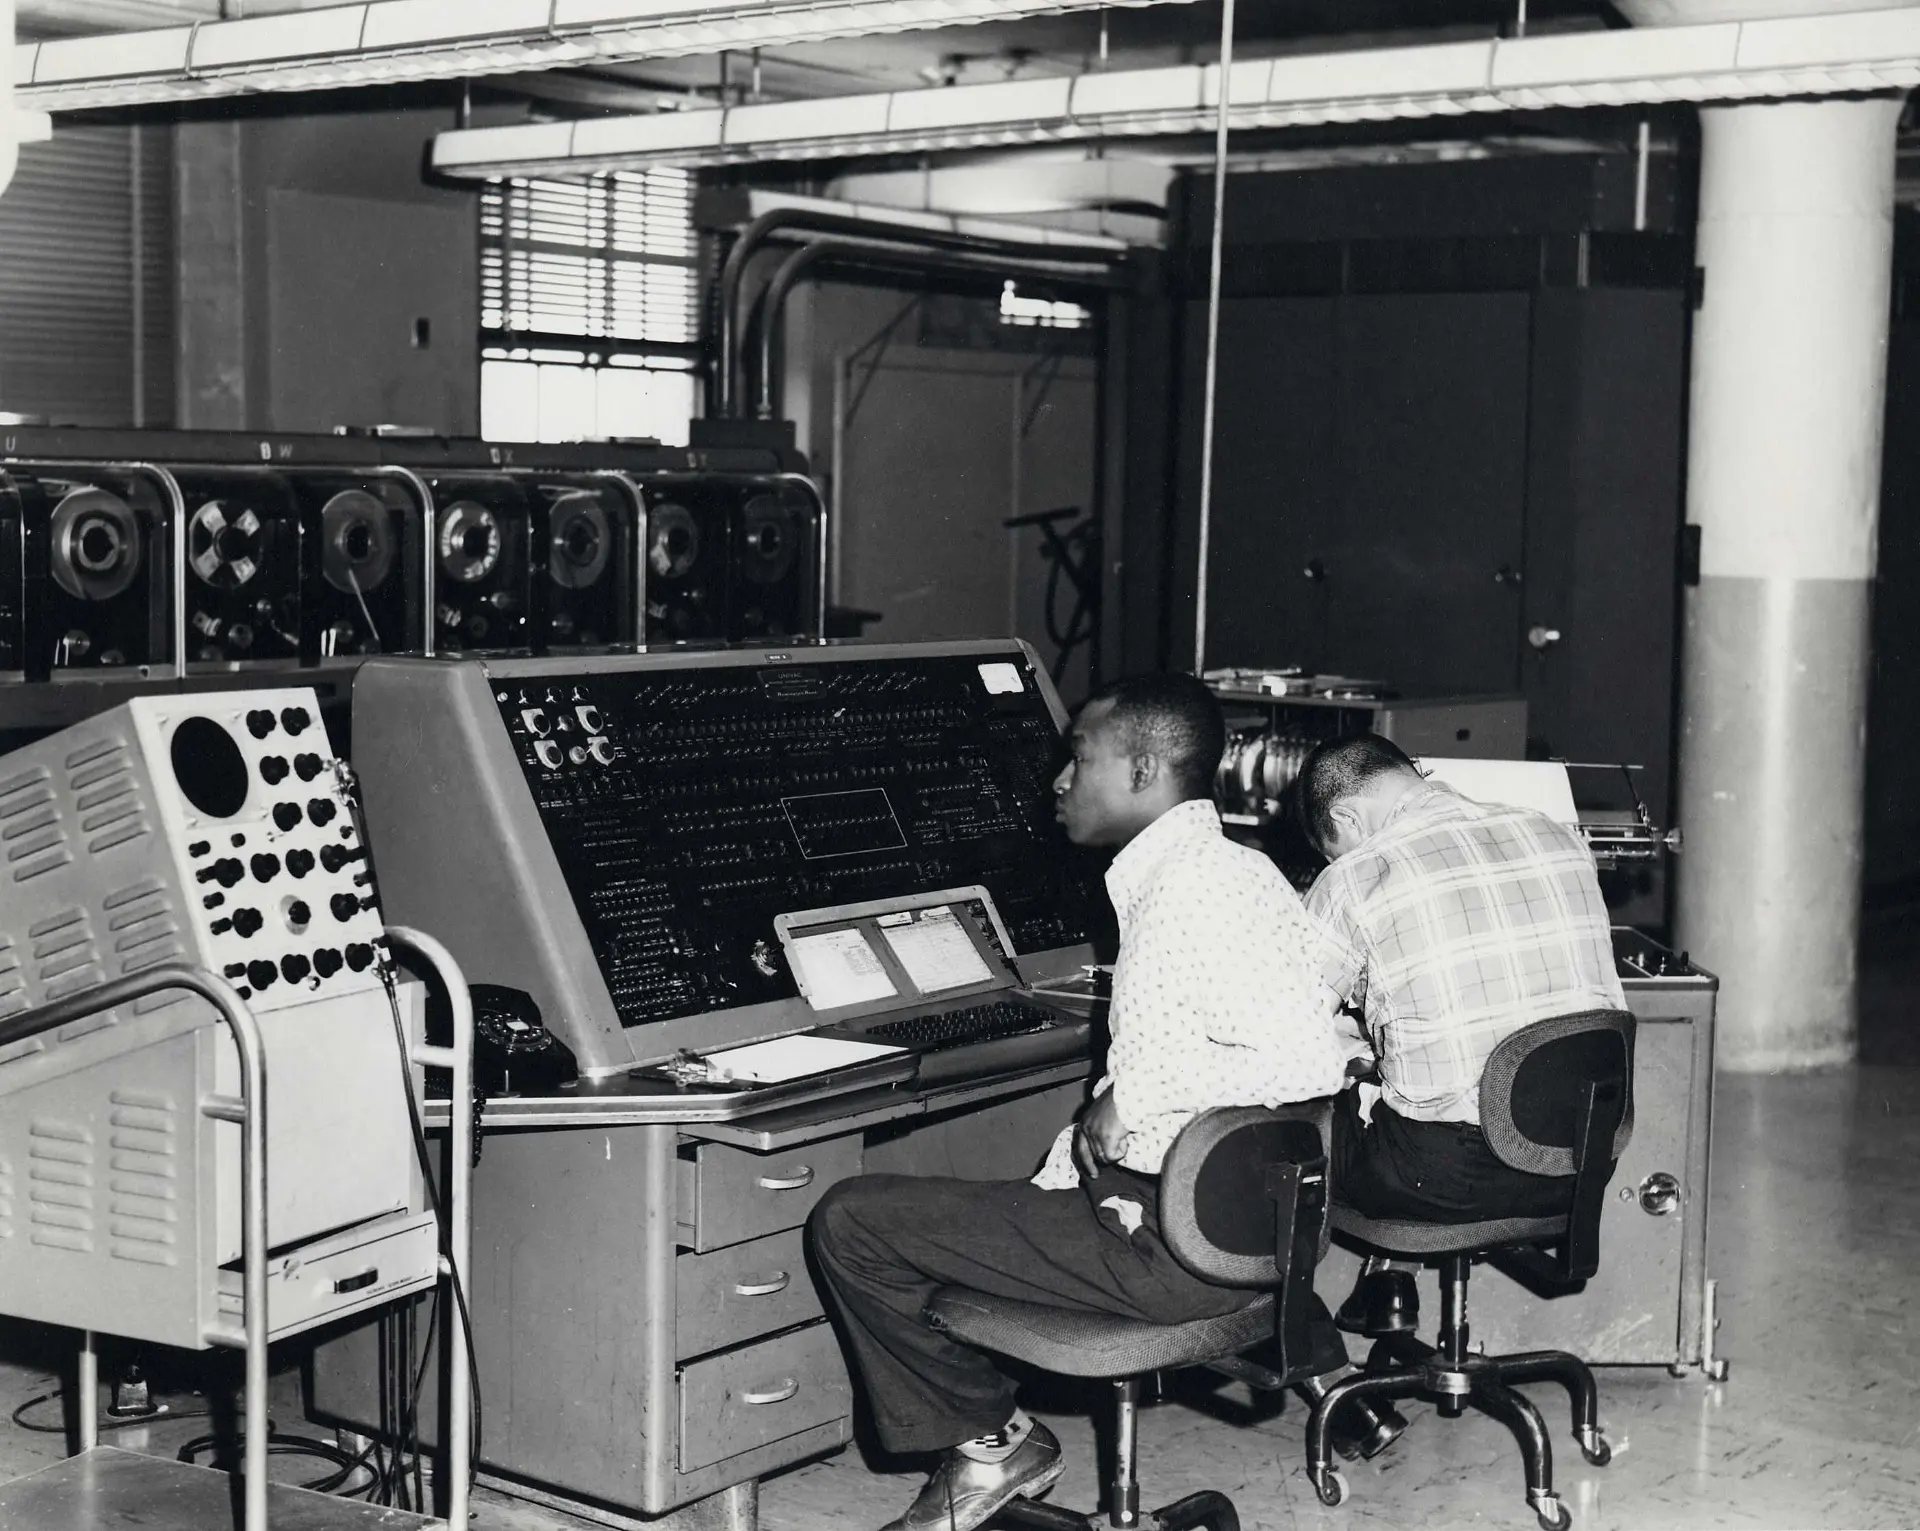
A UNIVAC computer at the U.S. Census Bureau (c. 1960). Source: U.S. Census Bureau
This early deployment in 1951 was so successful that the Bureau later declared UNIVAC had never been involved in any error incident — a powerful vote of confidence in machine logic at a time when skepticism ran deep. Soon after, General Electric became the first private business to use UNIVAC, adopting it for payroll computation.
At the time, IBM dominated government installations. Their tabulators were already embedded across agencies. Many public-sector computing offices were effectively IBM-run — staffed by former IBM employees, running IBM systems, and thinking in IBM workflows. UNIVAC, though technically superior, was considered an outsider.
As one official put it:
“If I recommend UNIVAC and it fails, I made a mistake. If I recommend IBM and it fails, IBM made a mistake.”
B12_UNIVAC_CENSUS_GE
B13_UNIVAC_GOVERNMENT
To adopt UNIVAC in the early 1950s was to defy the gravitational pull of IBM. Its tabulators and staff dominated the U.S. government offices so thoroughly that breaking away looked like betrayal. Choosing UNIVAC meant stepping outside the safe default, accepting personal responsibility if the new system failed.
For the Census Bureau and General Electric, that decision carried as much political risk as technical risk — a calculated act of institutional defiance that showed electronic processing could challenge the incumbent order.
B13_UNIVAC_GOVERNMENT

UNIVAC in Government and Military — Cold War Logistics
By the mid-1950s, the U.S. Air Force and other federal agencies had adopted UNIVAC systems for logistical planning, missile tracking, and resource scheduling. These systems weren’t designed for battlefield control, but served instead as part of the administrative backbone of Cold War operations.
UNIVAC’s ability to process alphabetic data was a major advantage, allowing for more complex record-keeping and scenario modeling than number-crunching machines alone.
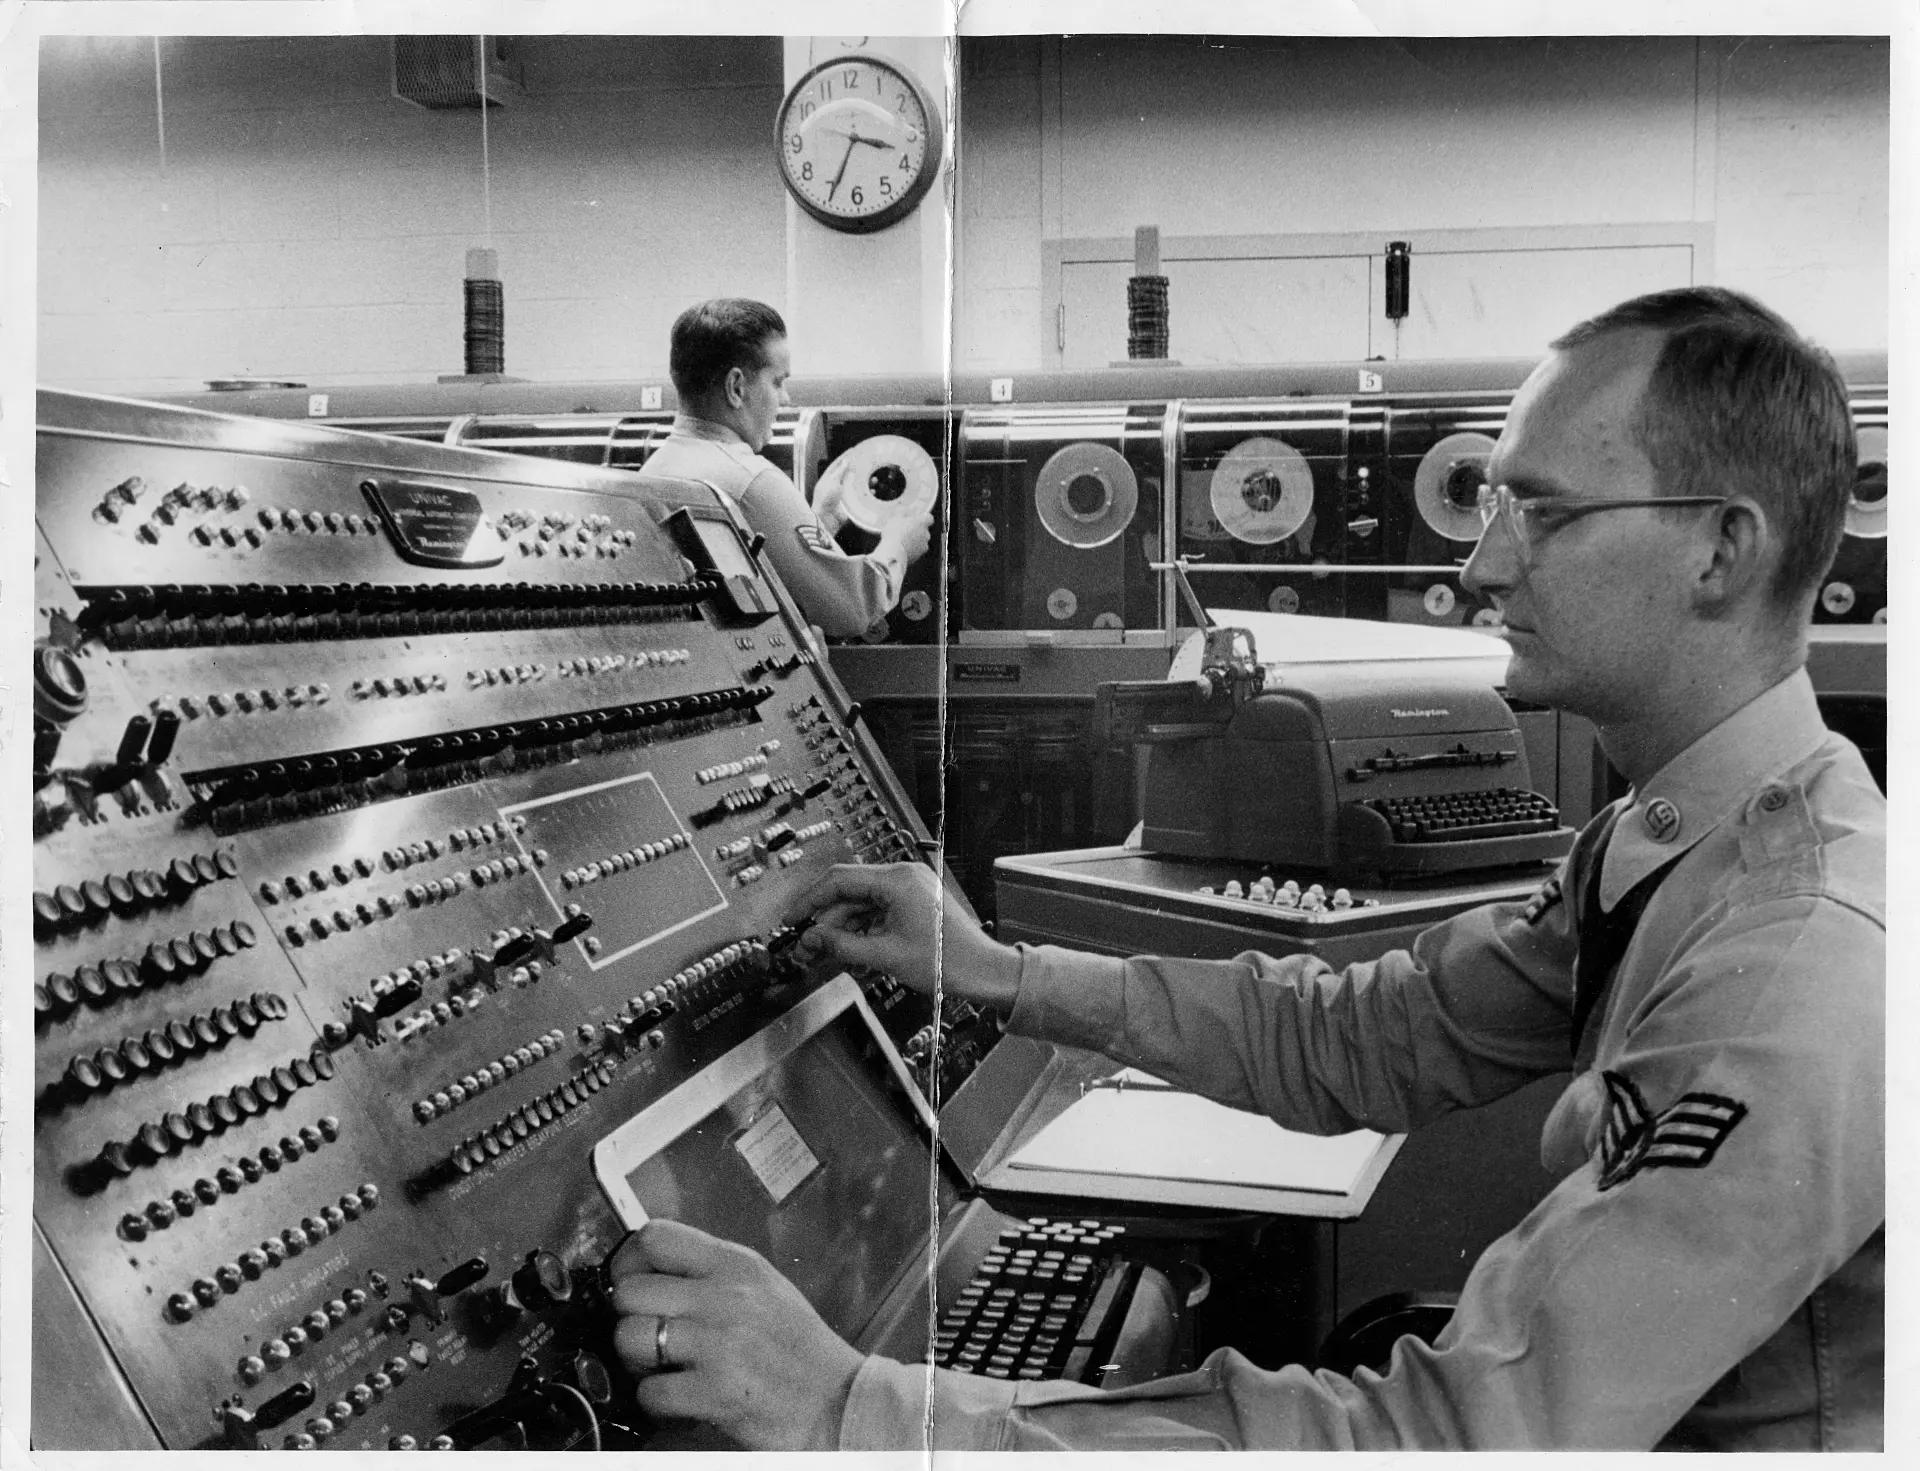
Air Force enlisted specialists operating a UNIVAC computer (July 28, 1956). Source: Special Collections and Archives; Wright State University Libraries
Toward the end of the decade, Remington Rand’s UNIVAC division was bidding alongside IBM for government defense contracts, embedding itself in the infrastructure of federal automation. Unlike IBM’s tightly controlled systems, UNIVAC’s flexibility and tape-based I/O made it attractive for unconventional environments — from defense logistics centers to early weather modeling programs.
B13_UNIVAC_GOVERNMENT
B14_UNIVAC_ENGINEERS
UNIVAC’s adoption by the Air Force showed how civilian business machines could be repurposed as tools of strategy. The same architecture that processed payrolls or census returns was reoriented toward missile inventories and nuclear logistics.
This blurred line between corporate data work and Cold War planning signaled a shift: information systems themselves had become part of the arsenal.
B14_UNIVAC_ENGINEERS

UNIVAC Engineers — From Startup to Corporate Backing
J. Presper Eckert and John Mauchly, already known for ENIAC, left wartime research to form the Eckert–Mauchly Computer Corporation. Their aim was to build a “universal automatic computer” that could handle business records as easily as equations.
UNIVAC began not with a corporation but with two engineers pushing an idea beyond ballistics. But their startup struggled: capital was scarce, the market uncertain, and the technology untested.
In 1950, the project was absorbed by Remington Rand, a typewriter and office-equipment giant with money and distribution power. That merger kept the machine alive — and with it, the possibility of a commercial computing industry.
B14_UNIVAC_ENGINEERS
B16_FERRANTI
The transfer from Eckert and Mauchly’s fragile startup to Remington Rand revealed how computing needed more than invention — it needed industry. Ideas that began as technical experiments survived only when attached to corporate pipelines of capital, manufacturing, and sales. UNIVAC’s persistence was less about isolated genius than about finding an institutional body large enough to carry it forward.
B16_FERRANTI

Ferranti Mark I — Britain’s First Commercial Computer
While UNIVAC made waves in the U.S., the UK had its own breakthrough in 1951: the Ferranti Mark I, derived from the Manchester Mark I project at the University of Manchester. It holds the distinction of being the first commercially available stored-program digital computer — predating UNIVAC by a few months. While primarily delivered to research institutions, it marked the beginning of programmable computing as a product.
The machine was designed to process 20-bit words, with a memory architecture that included vacuum tube storage (each tube holding 64 words) and a magnetic drum with capacity for 512 pages. It sold for between £50,000 and £100,000, and crucially, was made available beyond the confines of academia or government labs.
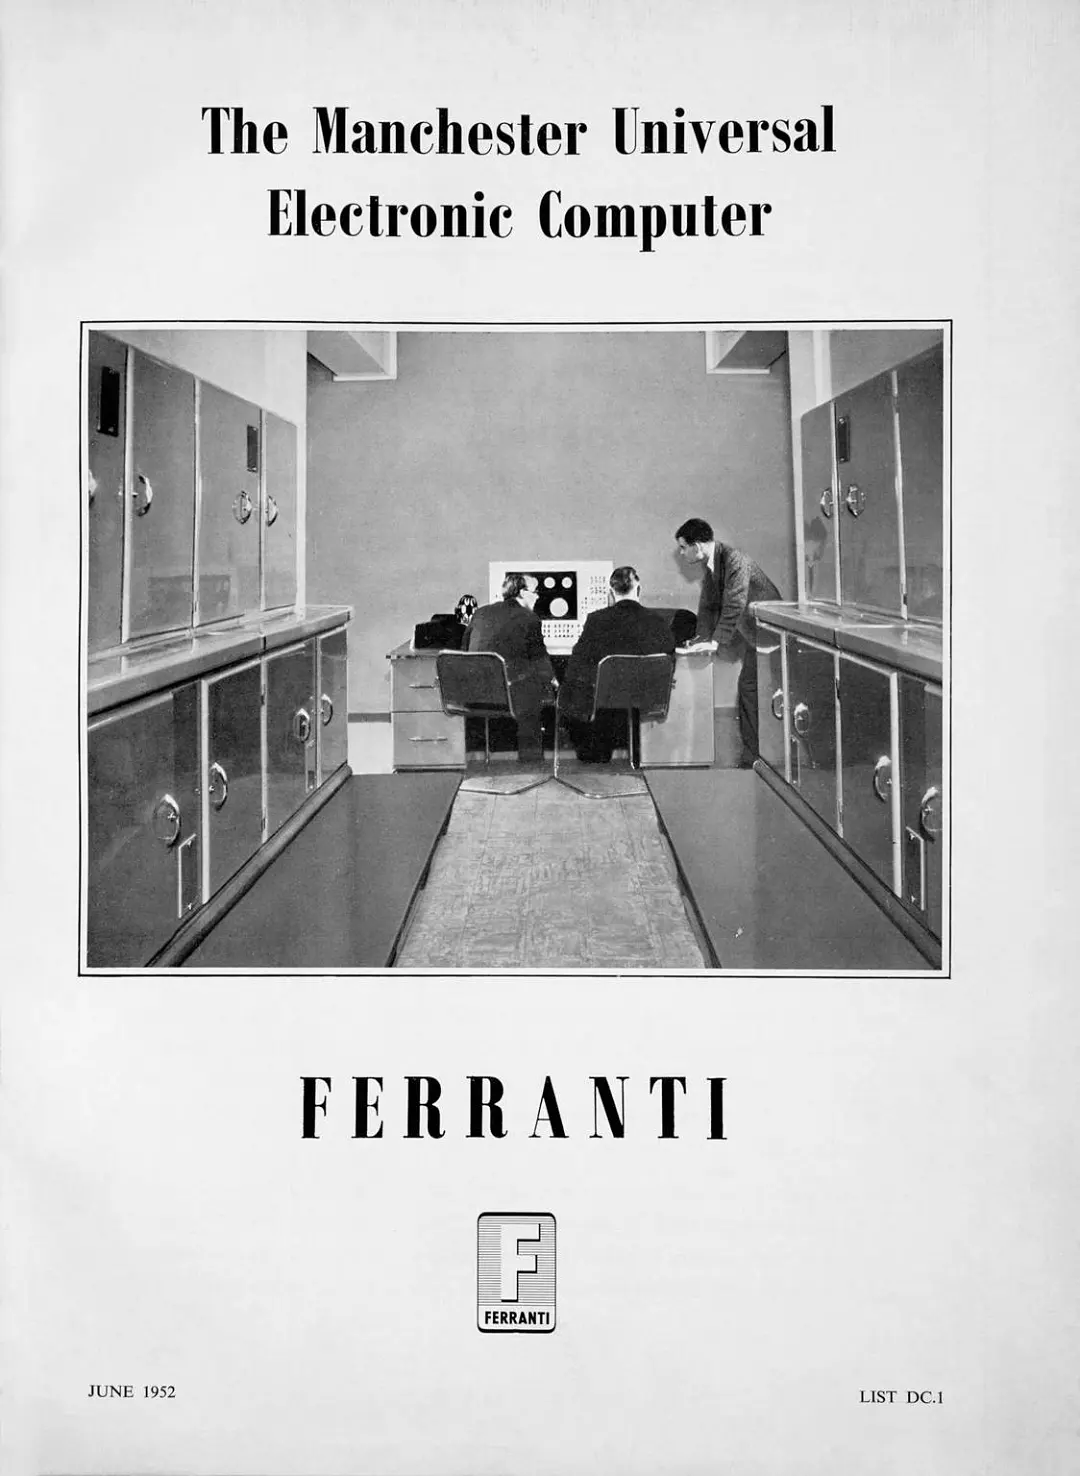
Alan Turing (right) with the Ferranti Mark I, 1952 — the only known photograph of Turing with a computer. The image appeared on the front cover of Ferranti’s Mark I brochure. Source: Science Museum Group Collection © The Board of Trustees of the Science Museum
The Ferranti Mark I supported a wide range of programs, from business analytics and scientific modeling to experimental computer music and some of the first computer games. Its stored-program design — the ability to modify instructions directly in memory — allowed far more complex data manipulation than earlier fixed-instruction machines.
B16_FERRANTI
B17_DNEPR
The Ferranti Mark I hinted at a new order, where software and algorithms could evolve independently of hardware. In Britain, the machine also served as a proof that national research could be translated into products and infrastructures to rival American advances.
B17_DNEPR

Dnipro (Dnepr) — Soviet Transistorized Computing
The Dnipro (Dnepr) computer, developed in Kyiv, Ukraine in the late 1950s and early 1960s, marked a key shift in Soviet computing: the move from vacuum tubes to transistors. It was part of a broader effort to modernize scientific and industrial computation across the USSR and its satellite states.
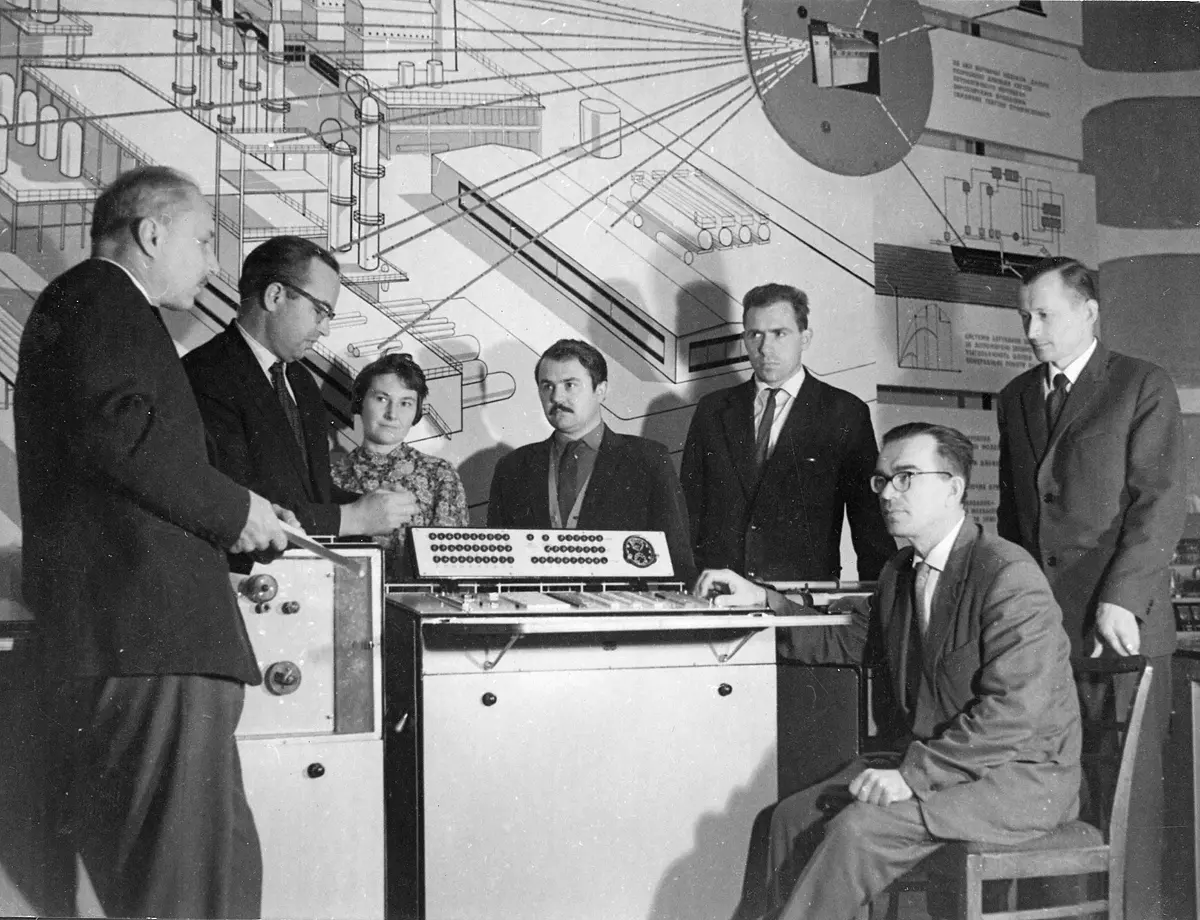
Academician Viktor Glushkov presenting the Dnipro computer at the Ukraine Fair, Kyiv (1962). Photograph by unknown author.
Designed for engineering calculations, process control, and scientific modeling, it found applications in aerospace, power generation, and metallurgy. Its general-purpose design allowed deployment across state institutions, though use remained tightly controlled by government and industrial planners.
Despite limited commercialization, the system marked the Soviet Union’s entry into the transistor era and its attempt to match Western advances in computing.
B18_CER

CER — Yugoslavia’s Independent Computing Path
Yugoslavia entered the digital age in the 1960s and 1970s with the CER (Cifarski Elektronski Računar) series, developed in Belgrade by the Mihajlo Pupin Institute. It was one of the first independent national computing initiatives outside the United States and the Soviet Union.
Early models like the CER-10 used transistor-based architecture with punched cards for input, later adding magnetic tape for storage and backup. The system featured 4 KB of magnetic core memory, expandable in later versions, and processing speeds in the tens of thousands of operations per second.
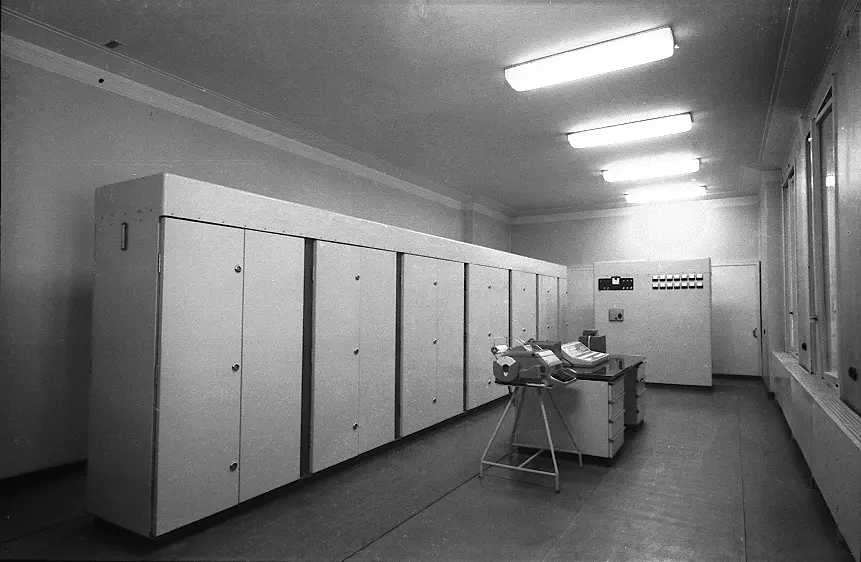
CER-10 computer at the Tanjug building (1963). Photograph by Dušan Hristanović.
CER machines were applied to scientific research, state statistics, and media tasks such as automated news distribution. They played a central role in modernizing Yugoslavia’s administrative and information infrastructure.
B18_CER
B19_CANNING_EDP
Yugoslavia’s CER machines embodied a political claim: that digital infrastructure could be built outside the Cold War superpowers. In practice, their role was less about rivalry than about administration. This was part of a broader turn in the 1960s, when computing itself began to be defined less by machines and more by the management of processes — what engineers and managers alike started to call electronic data processing.
B19_CANNING_EDP

Canning and Electronic Data Processing — Defining EDP
In 1956, statistician Richard Canning gave currency to the term Electronic Data Processing (EDP) to describe the systematic use of computers for managing information. He broke it into three integrated functions:
- Decision support — automating lower-level management choices using structured data.
- Order issuance — translating those decisions into paperwork such as production orders, invoices, and notices.
- Feedback control — comparing outputs with goals and flagging discrepancies for correction.
This definition emphasized decomposing workflows into discrete steps, sequencing tasks, and keeping data stored, checked, and synchronized. EDP became a framework for applying computers to large-scale projects, from military logistics to industrial production and business operations.
B19_CANNING_EDP
Cluster B2
By the mid-1950s, computing was no longer defined only by hardware. UNIVAC, Ferranti, Dnipro, and CER showed how machines could take root in government, business, and national projects. Canning’s language of electronic data processing gave this shift a name: computers started organizing flows of information into decisions, orders, and controls.
B2
Information Inventory
As computers spread into business and government in the 1960s, new ambitions emerged. The aim was no longer to automate single tasks, but to integrate every record of an organization into one system.
Engineers and managers began to imagine “information inventories” — digital mirrors of enterprises where payroll, logistics, production, and planning could be stored, searched, and updated in real time. These visions pushed computing from isolated applications toward models of total information management.
B21_INFORMATION_INVENTORY
Information Inventory — Toward Integrated Business Data
To make “information inventory” usable, designers emphasized indexing and navigation: maps and keys were imagined as ways to move through an ocean of records.
The urgency of integration grew as industrial systems became more complex: NASA’s Apollo program, for instance, involved millions of components, while military logistics had already outgrown manual handling.
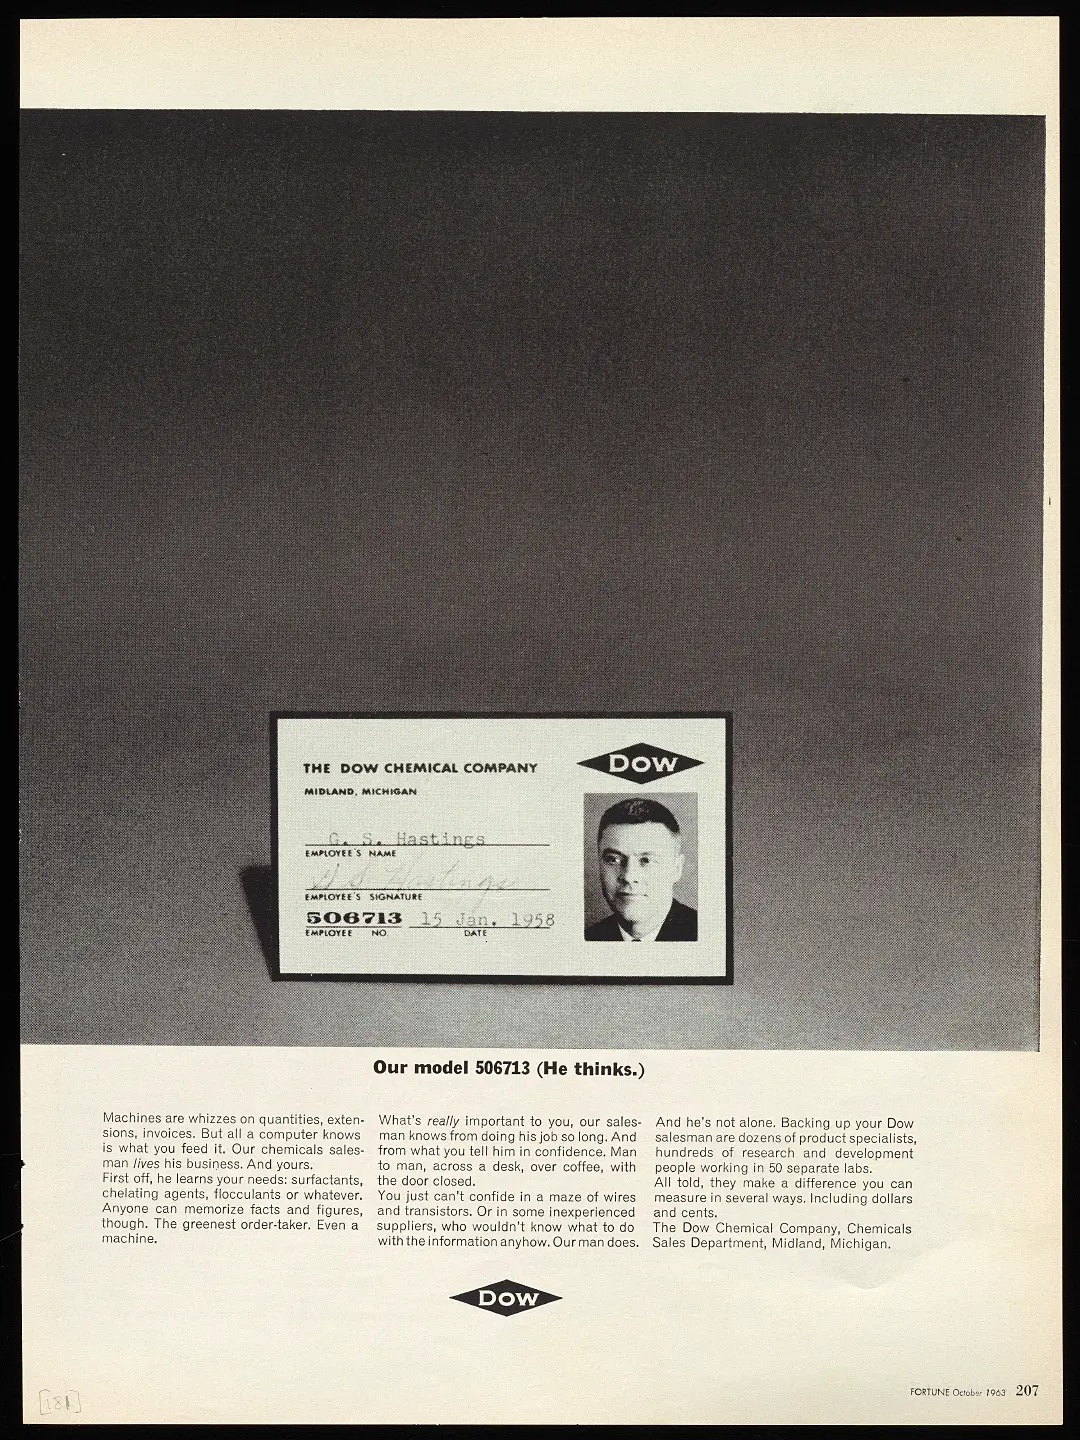
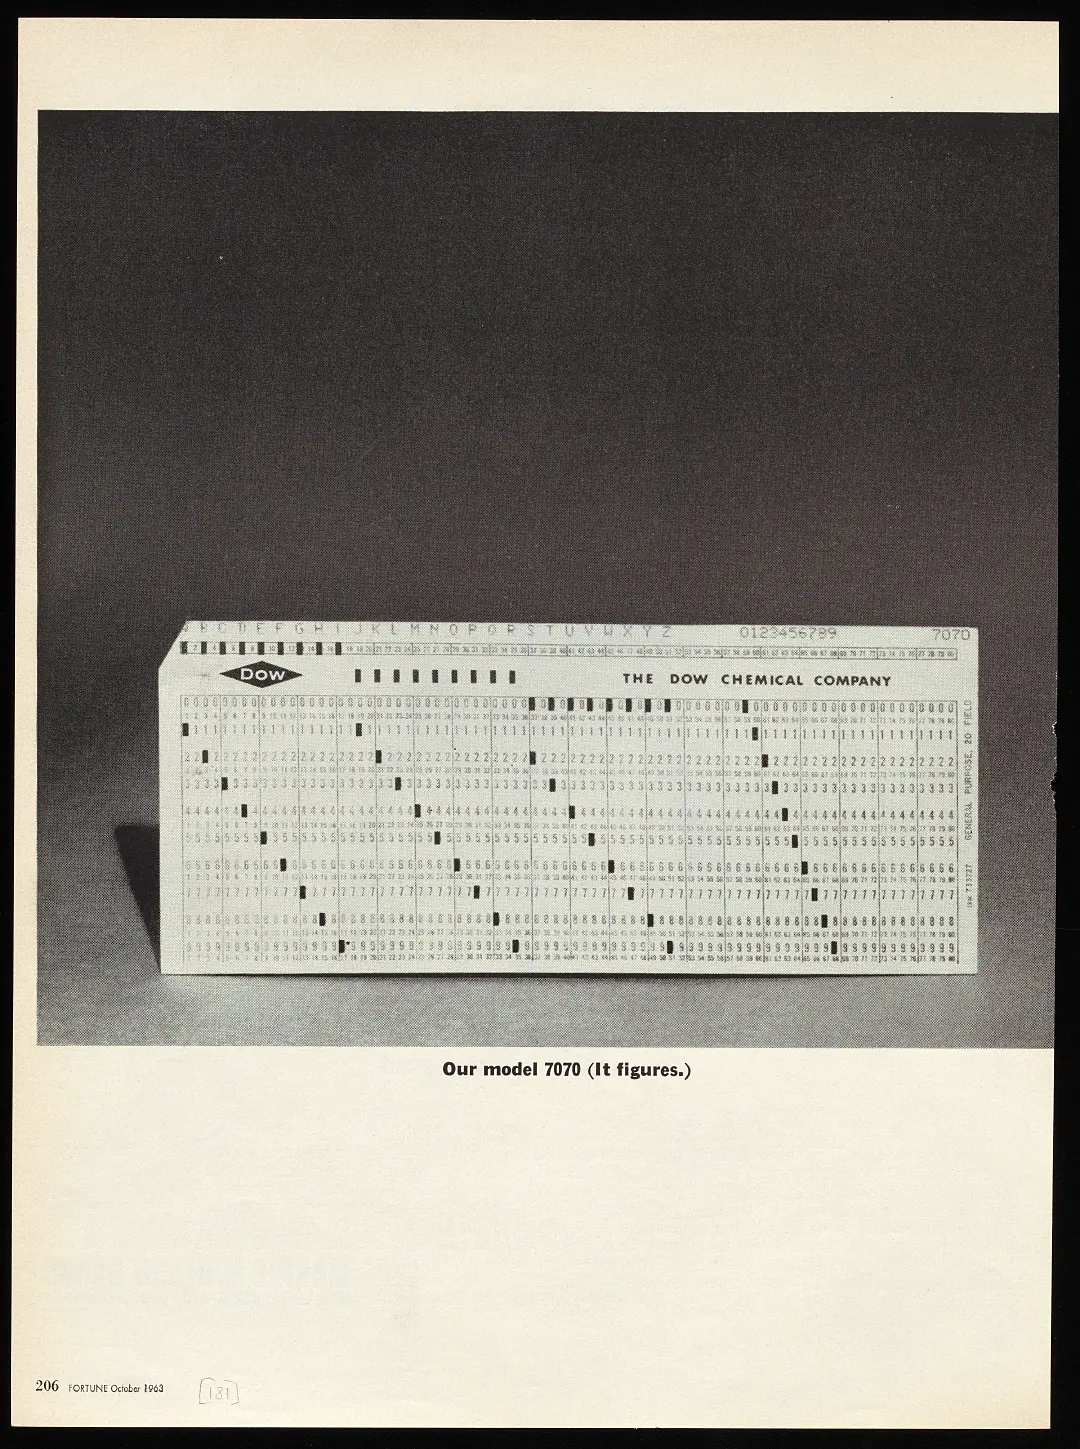
Dow Chemical advertisement, Fortune magazine, October 1963. A two-page spread contrasted IBM’s 7070 punch-card system (“Our model 7070 — It figures.”) with a Dow salesman’s ID badge (“Our model 506713 — He thinks.”), promoting human expertise over machine analysis. Source: Science History Institute
Dow Chemical advertisement, Fortune magazine, October 1963. A two-page spread contrasted IBM’s 7070 punch-card system (“Our model 7070 — It figures.”) with a Dow salesman’s ID badge (“Our model 506713 — He thinks.”), promoting human expertise over machine analysis. Source: Science History Institute
At Dow Chemical and later at General Electric, Charles Bachman faced the limits of separate departmental files. Dow’s early attempts at integration never took hold, but he carried forward the vision of shared, navigable data that could link records across the entire company.
B21_INFORMATION_INVENTORY
B22_BACHMAN_IDS
The information inventory concept reframed computing as a tool of administration. Instead of automating individual paperwork tasks, it sought to coordinate entire organizations by aligning data with managerial routines. Decision support, order issuance, and feedback control became part of a single cycle, with computers positioned as the infrastructure for running enterprises.
B22_BACHMAN_IDS

Bachman and IDS — Inventing the Network Model
At General Electric in the early 1960s, Charles Bachman led the development of the Integrated Data Store (IDS) — one of the earliest database management systems. IDS introduced the concept of an information inventory: a centralized, disk-based repository of shared records that could be queried and updated by multiple applications.
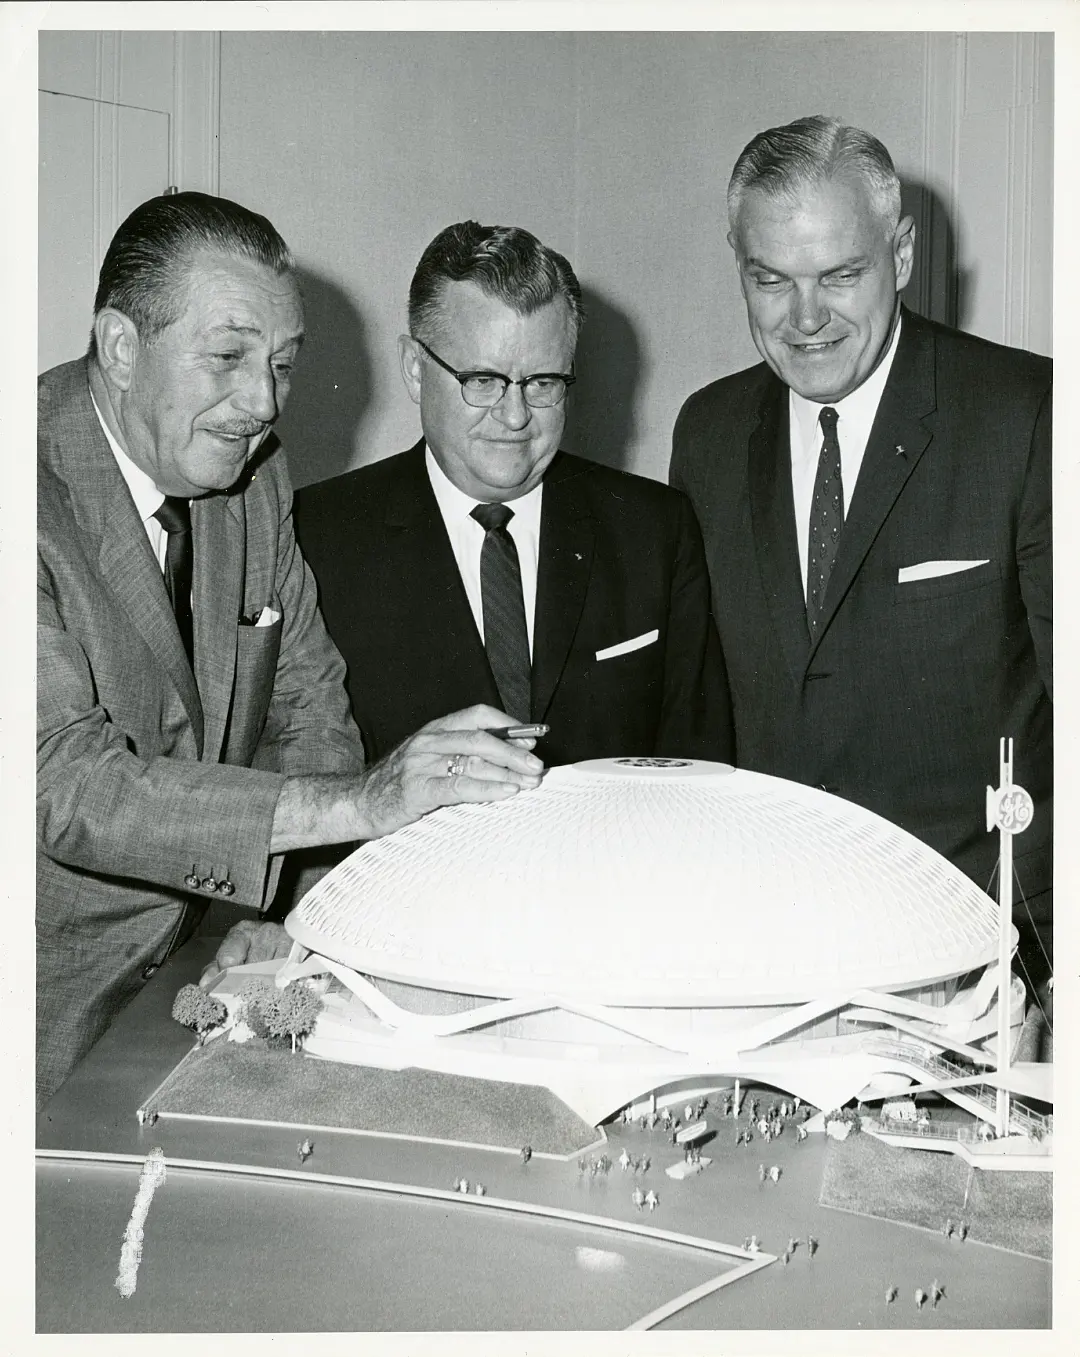
Walt Disney with GE president Gerald L. Phillipe at the Progressland Pavilion, New York World’s Fair (1964). Source: Smithsonian Institution Archives
This architecture enforced relationships between records — what would later be called the network data model. IDS supported a data dictionary to track record structures and allowed programmers to retrieve or update data using early forms of a data manipulation language.
IDS ran on the GE-225 computer, paired with the MRADS disk system — offering random access to data, rather than the sequential tape storage common at the time. Its first major deployment, MIACS (Manufacturing Information and Control System), provided real-time production control at a GE factory in Philadelphia.
By unifying data storage and enabling shared access, IDS became the prototype for modern database systems. In 1973, Bachman received the Turing Award for this work.
B22_BACHMAN_IDS
B23_WEYERHAEUSER_IDS
IDS showed the capability of computing as a platform for coordination: production schedules, inventories, and records could be aligned within a single system. What began as a technical experiment inside GE pointed to a new model of processing — data as a common resource rather than a series of isolated tasks.
B23_WEYERHAEUSER_IDS

Weyerhaeuser IDS — A Real-Time Business Network
In 1965–1966, Weyerhaeuser, a major U.S. timber company, became the first non-GE customer to implement IDS — turning the database into the foundation for a real-time, nationwide business system.
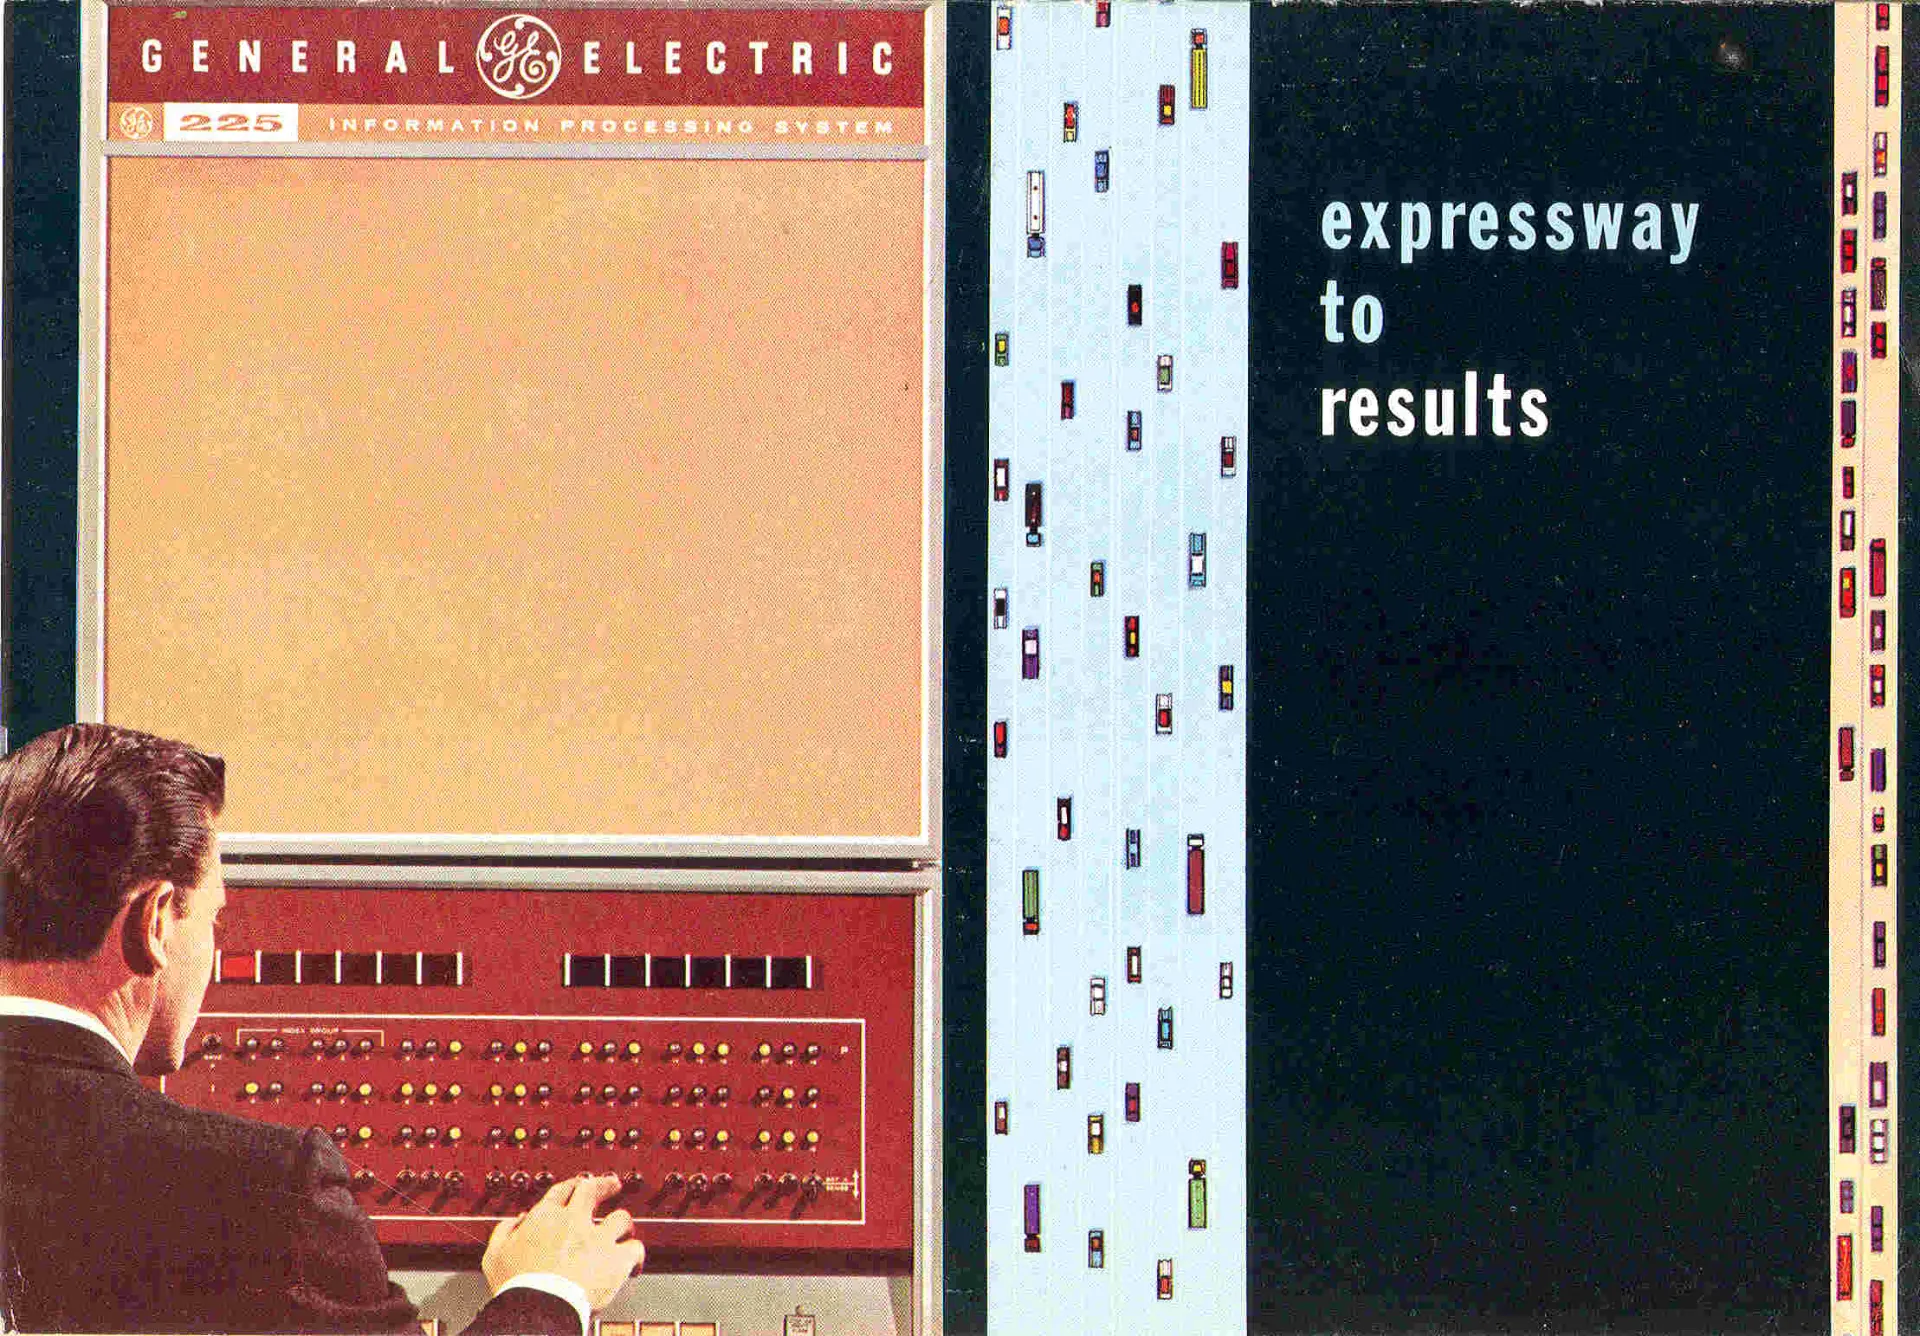
Sales brochure for the GE-200 series computer (1960s). The platform was later used for early IDS implementations. Source: Ferretonix.com
The setup linked over 100 remote teletype terminals to a central GE-235 computer using a DATANET-30 network. Orders placed across the country were entered directly into the system, which updated inventory, managed shipping logistics, and generated invoices.
The system used Problem Controller, an early form of online transaction processing (OLTP), to prioritize and manage concurrent requests. At peak demand, transaction volumes briefly overwhelmed the system, but the architecture proved robust and adaptable.
B23_WEYERHAEUSER_IDS
B24_SOVIET_PARADOX
Weyerhaeuser’s system showed how databases could become part of the operating core of a company. Inventory, logistics, and orders were no longer separate files but interconnected records managed in real time. In this setting, computing stopped being an accessory to administration and became its medium. The lesson was that processing power could coordinate entire organizations.
B24_SOVIET_PARADOX

The Soviet Information Paradox — Power, Plans, and Resistance
By the late 1950s, the Soviet Union faced a contradiction: while its military and scientific sectors deployed digital computers with growing sophistication, civilian institutions — especially Gosplan, the State Planning Committee — remained wary of adopting the same tools.
The USSR had previously used imported tabulators like Powers and Hollerith machines, later building its own analogs such as the T-5, exported to other socialist countries. But the leap to electronic computing was politicized. Even as Gosplan quietly launched its own Computer Center in 1959 and installed its first Ural-2 machine in 1960, internal resistance to large-scale data automation persisted.
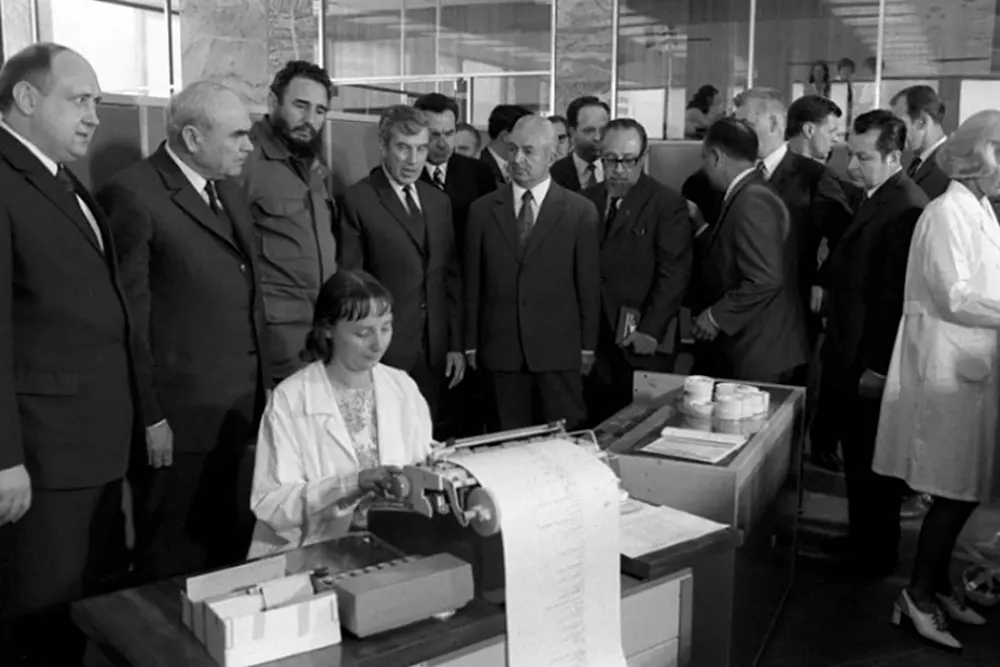
Fidel Castro at the Main Computer Center of the USSR State Planning Committee, Moscow (1972), with Nikolai Baibakov, chairman of Gosplan, and Nikolai Lebedinsky, head of the center. Source
The paradox deepened in the 1960s. Despite new equipment — including British Elliott 403 and ICL System-4 machines — and cooperation with East Germany on ALGOL translators, Gosplan remained cautious.
A proposed national automation system, the OGAS network, led by cybernetician Victor Glushkov, envisioned a nationwide digital system for economic planning. But it was blocked — not due to technical failure, but because it threatened existing institutional control over data flows. In the Soviet model, information was not only infrastructure but also political power.
B24_SOVIET_PARADOX
B25_OGAS_PROJECT
In the Soviet Union, computing could never be treated as neutral infrastructure. Cybernetics itself had once been denounced as “bourgeois pseudoscience,” and even after its partial rehabilitation, every attempt to expand automation ran into political suspicion.
The OGAS project revealed the paradox in sharp form: the technical capacity to build a nationwide planning network existed, but implementation meant redistributing authority. Ministries defended their own data, party officials feared loss of control, and information itself became a contested resource. Processing power was available — but it could not be separated from the politics of who was allowed to use it.
B25_OGAS_PROJECT

OGAS — The Internet That Almost Was
In the 1960s, Soviet cybernetician Victor Glushkov proposed a nationwide network of computers to manage the USSR’s economy in real time. Called OGAS (Общегосударственная автоматизированная система учёта и обработки информации), or the National Automated System for Computation and Information Processing, it aimed to unify factories, ministries, and planners in a single, continuously updated digital infrastructure.
The proposed system included regional computing centers linked to central hubs in a three-tier architecture, real-time inputs from across industries, and automated modeling to aid planning. Terminals were planned for remote enterprises, from industrial plants to mining sites and state-owned farms.
Glushkov’s team at the Kyiv Institute of Cybernetics had experience in systems design, and prototypes for smaller-scale implementations already existed. But OGAS never launched.
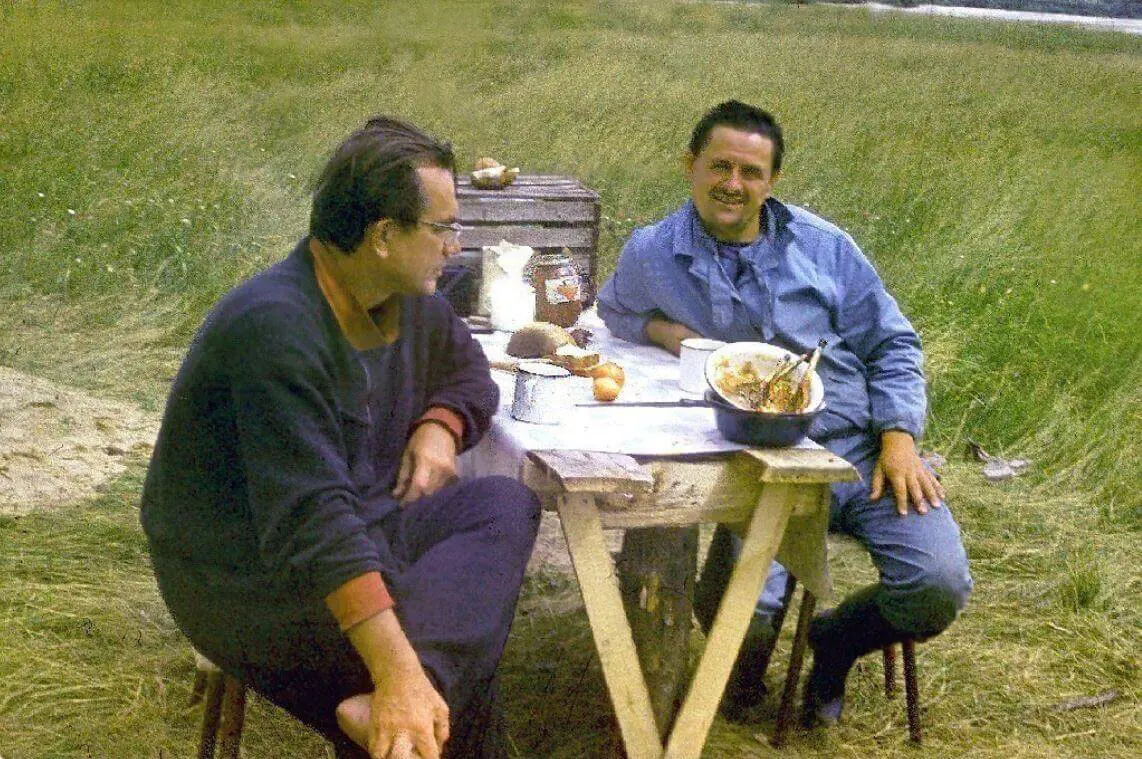
Victor Glushkov with Tadeusz Marjanovich, who led process-modeling research at the Kyiv Institute of Cybernetics. Near Kyiv, 1970s. Source: Glushkov family archive
The system promised transparency, efficiency, and redistributed authority, challenging the entrenched gatekeepers of economic knowledge. Despite repeated proposals through the late 1960s and early 1970s, OGAS was quietly defunded, gutted, and eventually abandoned.
B25_OGAS_PROJECT
B26_GE225_VS_IBM1401
The Soviet Union had the expertise to design a nationwide network, but not the institutional flexibility to allow it to function. In the same decade, American firms were locked in market competition, refining business data processing into the standard model that still shapes enterprise computing today. The contrast showed how processing could evolve into infrastructure — or be strangled before it began.
B26_GE225_VS_IBM1401

GE-225 vs IBM 1401 — Rival Models of Business Computing
In the early 1960s, two very different machines shaped how organizations approached digital information: the General Electric GE-225 and the IBM 1401.
The GE-225, introduced in 1960, was built for power and flexibility. It featured simultaneous input/output handling, supported both alphabetic and numeric data, and could connect to disk drives like MRADS. Input came from magnetic tape, punched cards, MICR documents, and even paper tape, with long-distance connections supported via the DATANET-15. It was a machine for custom-built systems like real-time data integration.
Meanwhile, the IBM 1401, released in 1959, took the market by storm with its affordability and reliability. Its six-bit character system, magnetic core memory (4K–16K), and decimal arithmetic made it perfect for payroll, billing, and inventory. Leased for around $2,500/month, it brought computing within reach of small and mid-sized businesses — earning the nickname "the Model T of the computer industry."
IBM 1401 computing the results for the city of Kiel, West Germany, during the federal election (1965). Source
Their rivalry wasn’t just about specs — it was about philosophies:
- IBM offered safe, standardized tools for the mainstream.
- GE pushed toward modularity, extensibility, and integration.
The GE-225 later found academic life as well — a time-sharing version at Dartmouth became the birthplace of the BASIC programming language.
B26_GE225_VS_IBM1401
Cluster B3
By the mid-1960s, databases were no longer only technical experiments. They had become tools for business, contested instruments of state planning, and competing visions of how information should be organized. Across the Atlantic divide, companies and governments pursued different strategies, but the stakes were converging: whoever mastered the storage and movement of records would shape how economies functioned.
B3
COBOL — From Business Language to Standard
At the turn of the 1960s, computers were already processing vast quantities of business data, but they lacked a common language. Each manufacturer promoted its own programming systems, locking users into specific machines and workflows.
The push for a business-oriented language brought together an unusual alliance. Out of that effort came COBOL, designed not for scientists but for clerks and managers, promising to make programs portable and data processing more standardized.
B31_COBOL_CREATION

The Birth of COBOL — A Business Language for All
In May 1959, over 40 representatives from government, industry, and academia gathered at the Pentagon to address a growing problem: early computer languages were difficult to learn and maintain, limiting business adoption. Their solution was CODASYL — the Conference on Data Systems Languages — a volunteer group aimed at creating a common, English-like programming language for business.
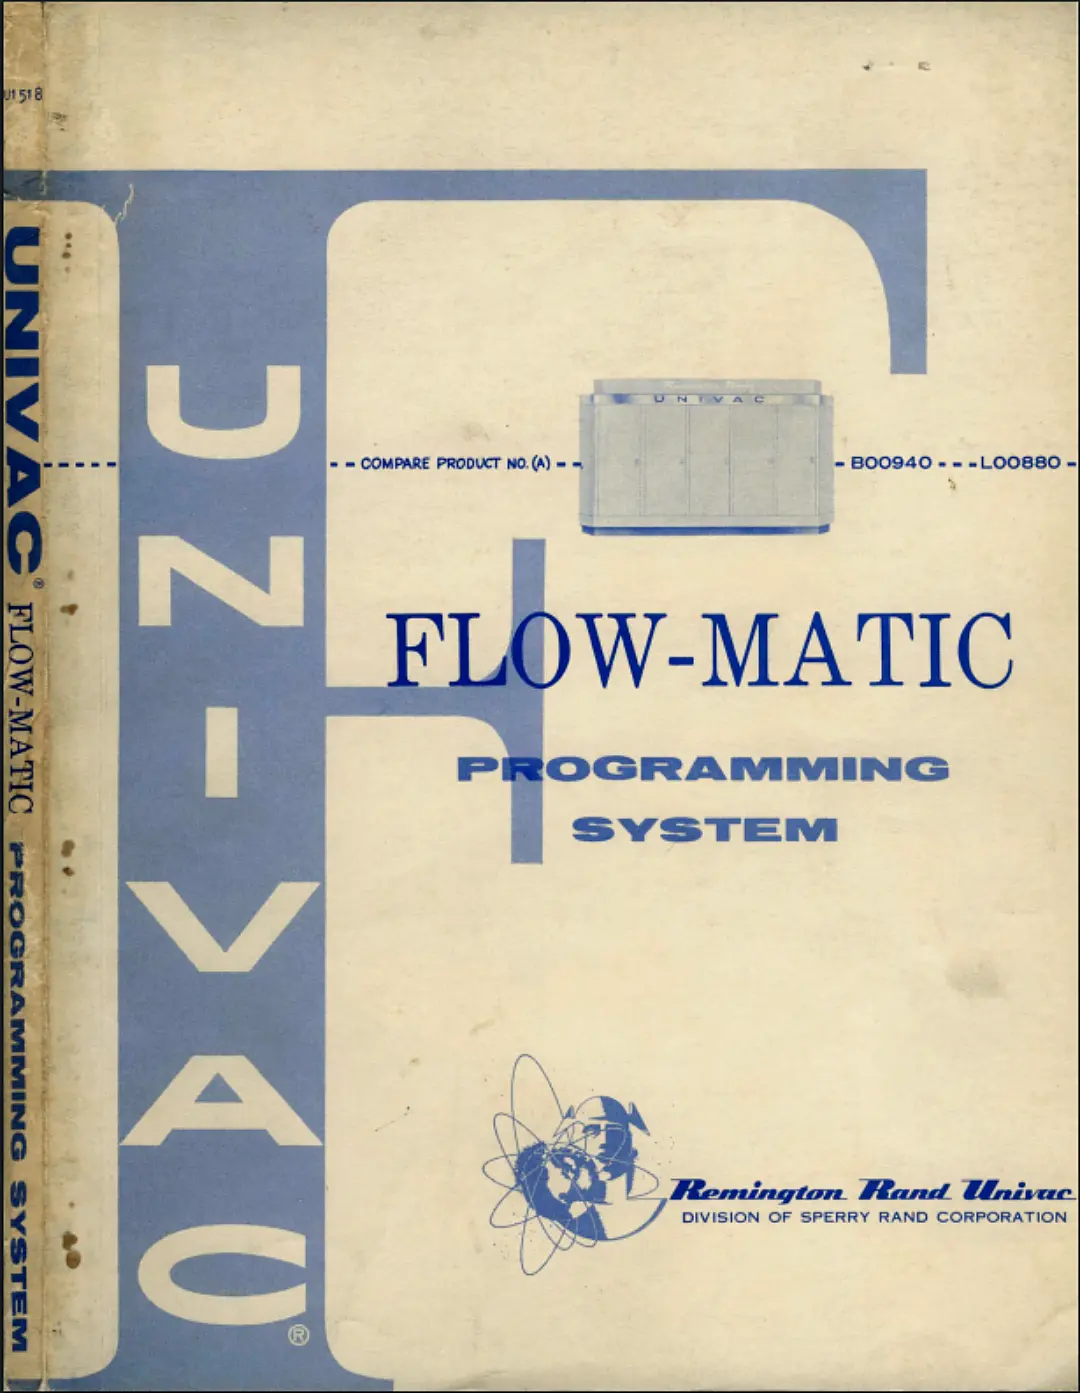
Cover of the FLOW-MATIC programming system manual, developed by Grace Hopper at Remington Rand (1958). Source: Bitsavers
At the time, Grace Hopper’s FLOW-MATIC, developed at Remington Rand UNIVAC, was the only business-oriented language using human-readable commands. Hopper, a pioneering computer scientist and naval officer, had long championed making programming more accessible. The committee, with members from Burroughs, Honeywell, IBM, RCA, Sperry Rand, and Sylvania, drew inspiration from her work.
On December 6, 1960, a live demonstration proved COBOL could compile and run the same code on both UNIVAC and RCA systems — a landmark moment for interoperability.
B31_COBOL_CREATION
B32_HARDWARE_OF_COBOL
COBOL’s creation reframed how processing was understood. Instead of writing cryptic machine code, programmers could issue instructions in something close to plain English. This shift lowered the cost of training and expanded the pool of potential programmers.
In practice, teaching machines a human-readable language proved easier than expecting managers and engineers to learn machine dialects. Standardization turned programming into a shared resource, laying the foundation for software as an industry.
B32_HARDWARE_OF_COBOL

Hardware of COBOL — The Machines Behind the Language
COBOL wasn’t designed in a vacuum — it was shaped by the constraints and capabilities of the early business computers it was meant to run on. The language was intended for high-volume, data-driven tasks on large systems like the UNIVAC I and II, IBM 705, Honeywell 800, RCA 501, Sylvania MOBIDIC, and Burroughs B-5000.
Grace Hopper speaking in 1982 about running COBOL and FORTRAN on various machines.
These machines varied widely in architecture and I/O capabilities, but COBOL’s standardization effort required them to speak a shared language. This forced a shift in how hardware designers thought about software compatibility, and it catalyzed interest in portable, high-level languages. The 1960 live demonstration of COBOL running on both UNIVAC and RCA systems proved the concept.
B32_HARDWARE_OF_COBOL
B33_EARLY_COBOL_APPLICATIONS
COBOL’s portability redefined the relationship between software and hardware. Programs could be conceived as transferable instructions, no longer bound to a single processor’s quirks.
That shift encouraged organizations to think of computing not in terms of registers and opcodes, but in terms of tasks, records, and flows of data. The idea of software as infrastructure began to take hold: an independent layer of logic that could outlive the machines it ran on.
B33_EARLY_COBOL_APPLICATIONS

Early COBOL Applications — From Contract Coding to AUTOFLOW
COBOL’s standardization opened the door to an entirely new market: commercial software development. In 1959, Advanced Data Research (ADR), a New Jersey–based firm, began offering contract programming services, specifically advertising COBOL expertise in Datamation magazine by 1961.
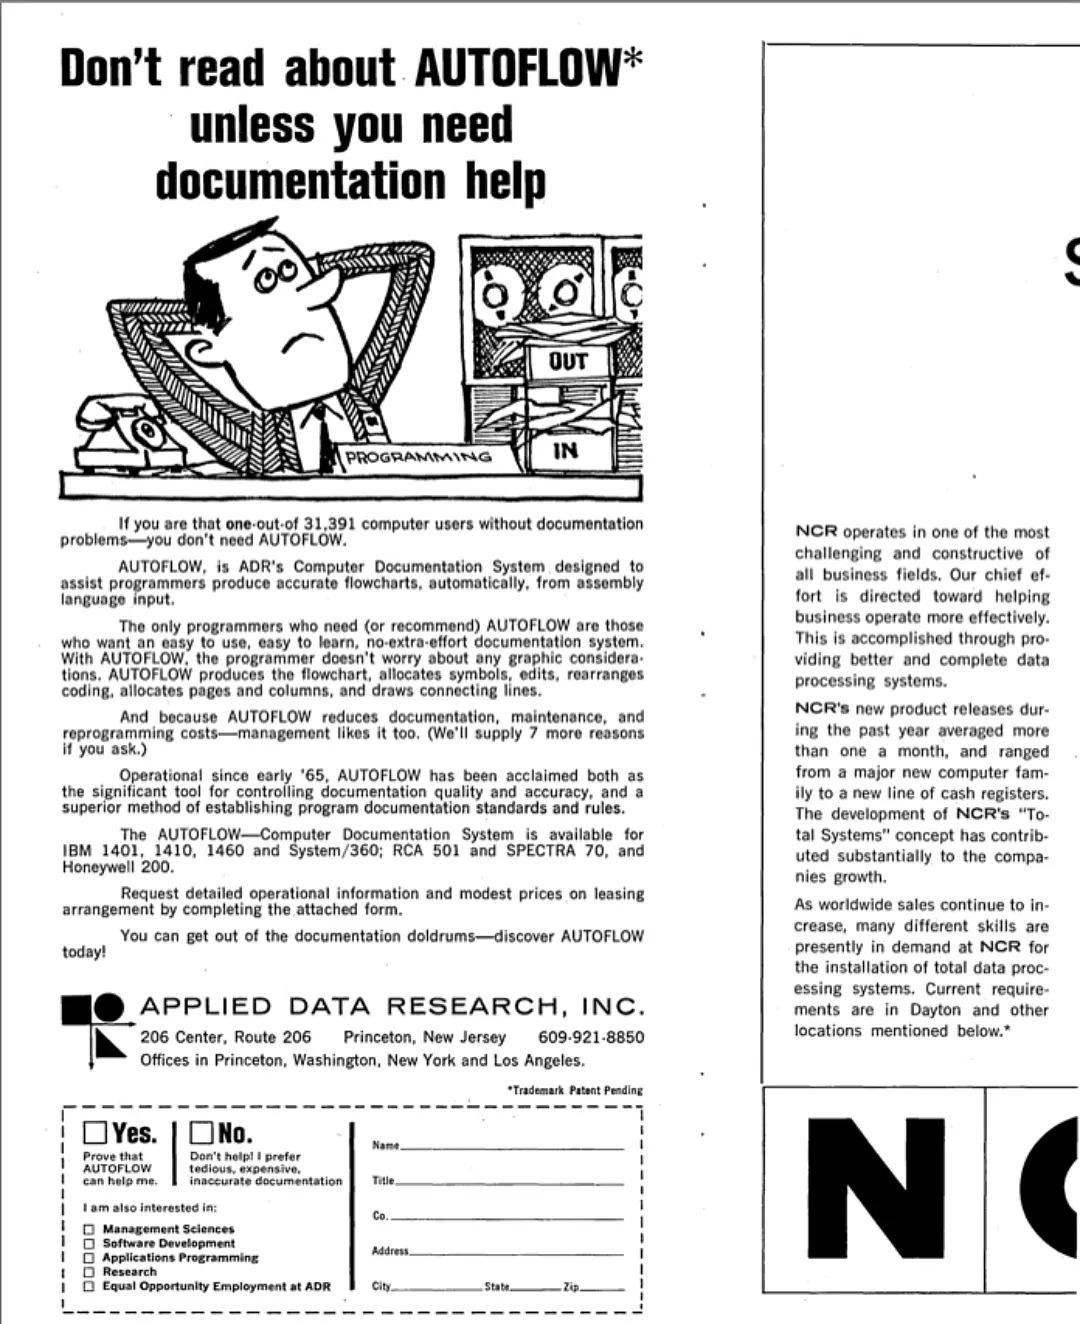
Advertisement for AUTOFLOW, a programmers’ assistance tool, in Datamation magazine (June 1966). Source: Bitsavers
One of ADR’s key products was AUTOFLOW, an application that automatically generated flowcharts from COBOL source code. At a time before video terminals, visualizing program logic on paper was essential. AUTOFLOW helped users trace and document complex logic paths, making it easier to debug, explain, or maintain large-scale software.
B33_EARLY_COBOL_APPLICATIONS
B34_SOVIET_COBOL
The spread of COBOL moved coding from a specialized craft inside machine-rooms to a professional market of its own. With ADR marketing AUTOFLOW directly to users, programming was becoming a business, with products, contracts, and careers defined around maintaining the new language of data processing.
B34_SOVIET_COBOL
COBOL Behind the Iron Curtain — Adaptation and Translation
Despite Cold War tensions, the Soviet Union closely followed developments in Western data processing — and COBOL did not go unnoticed. In 1965, the Kyiv-based journal Kibernetika published a technical overview of COBOL by Lyudmila Babenko, helping introduce the language to Soviet scientific circles. She later earned a PhD for formalizing COBOL-style data translation methods for mass data processing.
Soviet adaptations emerged rapidly: the Dnipro-2 control system, built in Kyiv, integrated COBOL-like translators designed by Kateryna Yuschenko’s team. Meanwhile, the Minsk-22 computer from Belarus offered its own compiler variant. These efforts reflected a broader drive to align with international standards while maintaining domestic engineering autonomy.
Kateryna Yushchenko, member of Victor Glushkov’s pioneering team in Soviet programming. In 1955 she created the Address programming language, introducing indirect addressing nearly a decade before similar features appeared in Western systems. Source: Yushchenko family archive
The arrival of the ES EVM (Unified System of Electronic Computers), based on IBM System/360, brought COBOL-style programming into the mainstream of Soviet and Eastern Bloc computing. By 1975, COBOL had received an official Soviet standard.
B34_SOVIET_COBOL
Cluster B4
The Soviet embrace of COBOL signaled that data processing was now central to economic planning, and that aligning with international norms could serve governance as much as engineering.
Across both East and West, COBOL’s spread marked a broader transformation: programming was no longer a patchwork of proprietary codes, but a shared infrastructure for business and government alike. The language made automation portable, training scalable, and software itself a transferable resource. By the mid-1970s, data processing had been reshaped not only by machines but by the codes that told them what to do.
B4
Business Data Management
By the late 1960s, businesses were beginning to think in terms of systems rather than isolated programs. Reservation platforms, financial networks, and enterprise databases bound together thousands of users and millions of transactions.
What distinguished this era was not the invention of new hardware or languages, but the orchestration of processes at scale. Computing was becoming a management tool — one that promised to coordinate complex organizations as efficiently as it handled numbers.
B41_DBMS_EMERGENCE

Managing Data — From Reports to Databases
In the early 1960s, computing began to move beyond producing static reports. Organizations were starting to manage dynamic, shared datasets. The first genuine database management systems (DBMSs) — GE’s IDS (1964) and IBM’s IMS (1965) — were built for disk drives and introduced persistent, structured storage that could be reused across applications.
The concept of a “database” itself came out of Cold War defense projects. In 1962, the System Development Corporation, which had worked on the SAGE air defense network, described shared repositories of information accessible to multiple users and programs — a step beyond archived output.
Airman First Class Trent Bailey, weapons controller technician, with Airman Toni Bailey, a new SAGE surveillance operator, Luke Air Force Base, Arizona (1975). NORAD newsletter archive. Source: Southwest Museum of Engineering,Communications and Computation
By the late 1960s, business computing circles were converging on the same need for consistent storage and retrieval. The CODASYL Data Base Task Group, backed by firms such as RCA and Remington Rand, began formalizing DBMS architecture. Their work intersected with advances in software portability and the push for standard program–data interfaces.
B41_DBMS_EMERGENCE
B42_DBMS_IBM_USERGROUPS
The move from reports to databases marked a conceptual shift: data was no longer treated as the end product of computation but as a resource to be stored, reused, and shared. Once businesses and governments began to see information as a live asset, the database became a platform for everything else — planning, coordination, and decision-making.
B42_DBMS_IBM_USERGROUPS

IBM’s Role — User Groups and the Rise of IMS
In 1957, IBM users formed SHARE and GUIDE groups to collaborate on programs for new hardware. Projects like SURGE and 9PAC extended the IBM 704/709’s capabilities. Though IBM didn’t develop them, it later supported and maintained 9PAC, seeing its value. These early systems experimented with data dictionaries, file hierarchies, and routines for migrating between hardware environments.
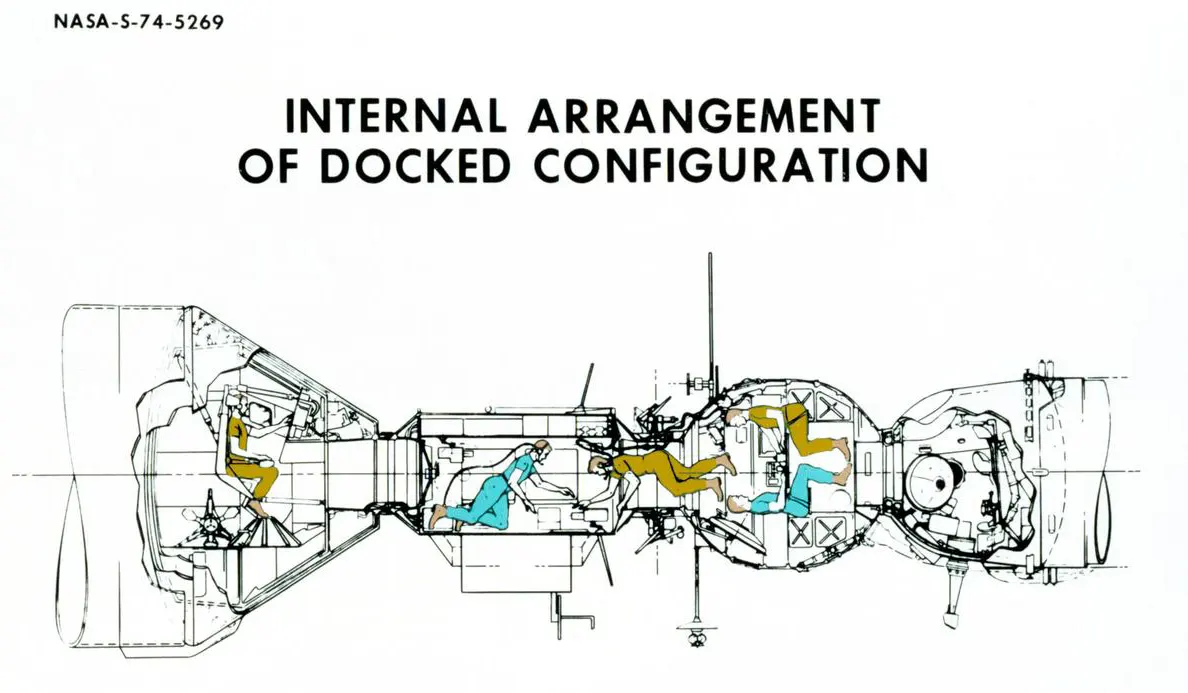
Apollo–Soyuz spacecraft in Earth orbit, docked configuration. NASA diagram (1974). North American Rockwell and IBM collaborated on systems for the Apollo program. Source: NASA Collection, S74-05269
Still, tape-based storage had limits. The real breakthrough came when IBM pivoted to disk — and partnered with aerospace contractor North American Rockwell to build IMS (Information Management System). Originally developed to manage components for the Apollo program, IMS pioneered hierarchical data models and multitasking data access.
By the late 1960s, IMS ran on IBM’s System/360 and supported multiple concurrent applications from a single memory image. IBM states that IMS still supports 95% of Fortune 1000 companies today.
B42_DBMS_IBM_USERGROUPS
B43_DBMS_HARDWARE
The early experiments of user groups showed that data handling could be organized collectively. IMS took that lesson and institutionalized it: databases were no longer improvised code libraries but packaged systems integrated into corporate computing.
B43_DBMS_HARDWARE

System/360 and Beyond — Hardware for Databases
IBM’s System/360, launched in 1964, introduced modular computers with upgrade paths, standardized architecture, and compatibility across a wide range of peripherals. Its design popularized the 8-bit byte, data channels, and 9-track magnetic tape, pushing the industry toward mass production and interoperability. European and Japanese manufacturers soon followed, building IBM-compatible systems.
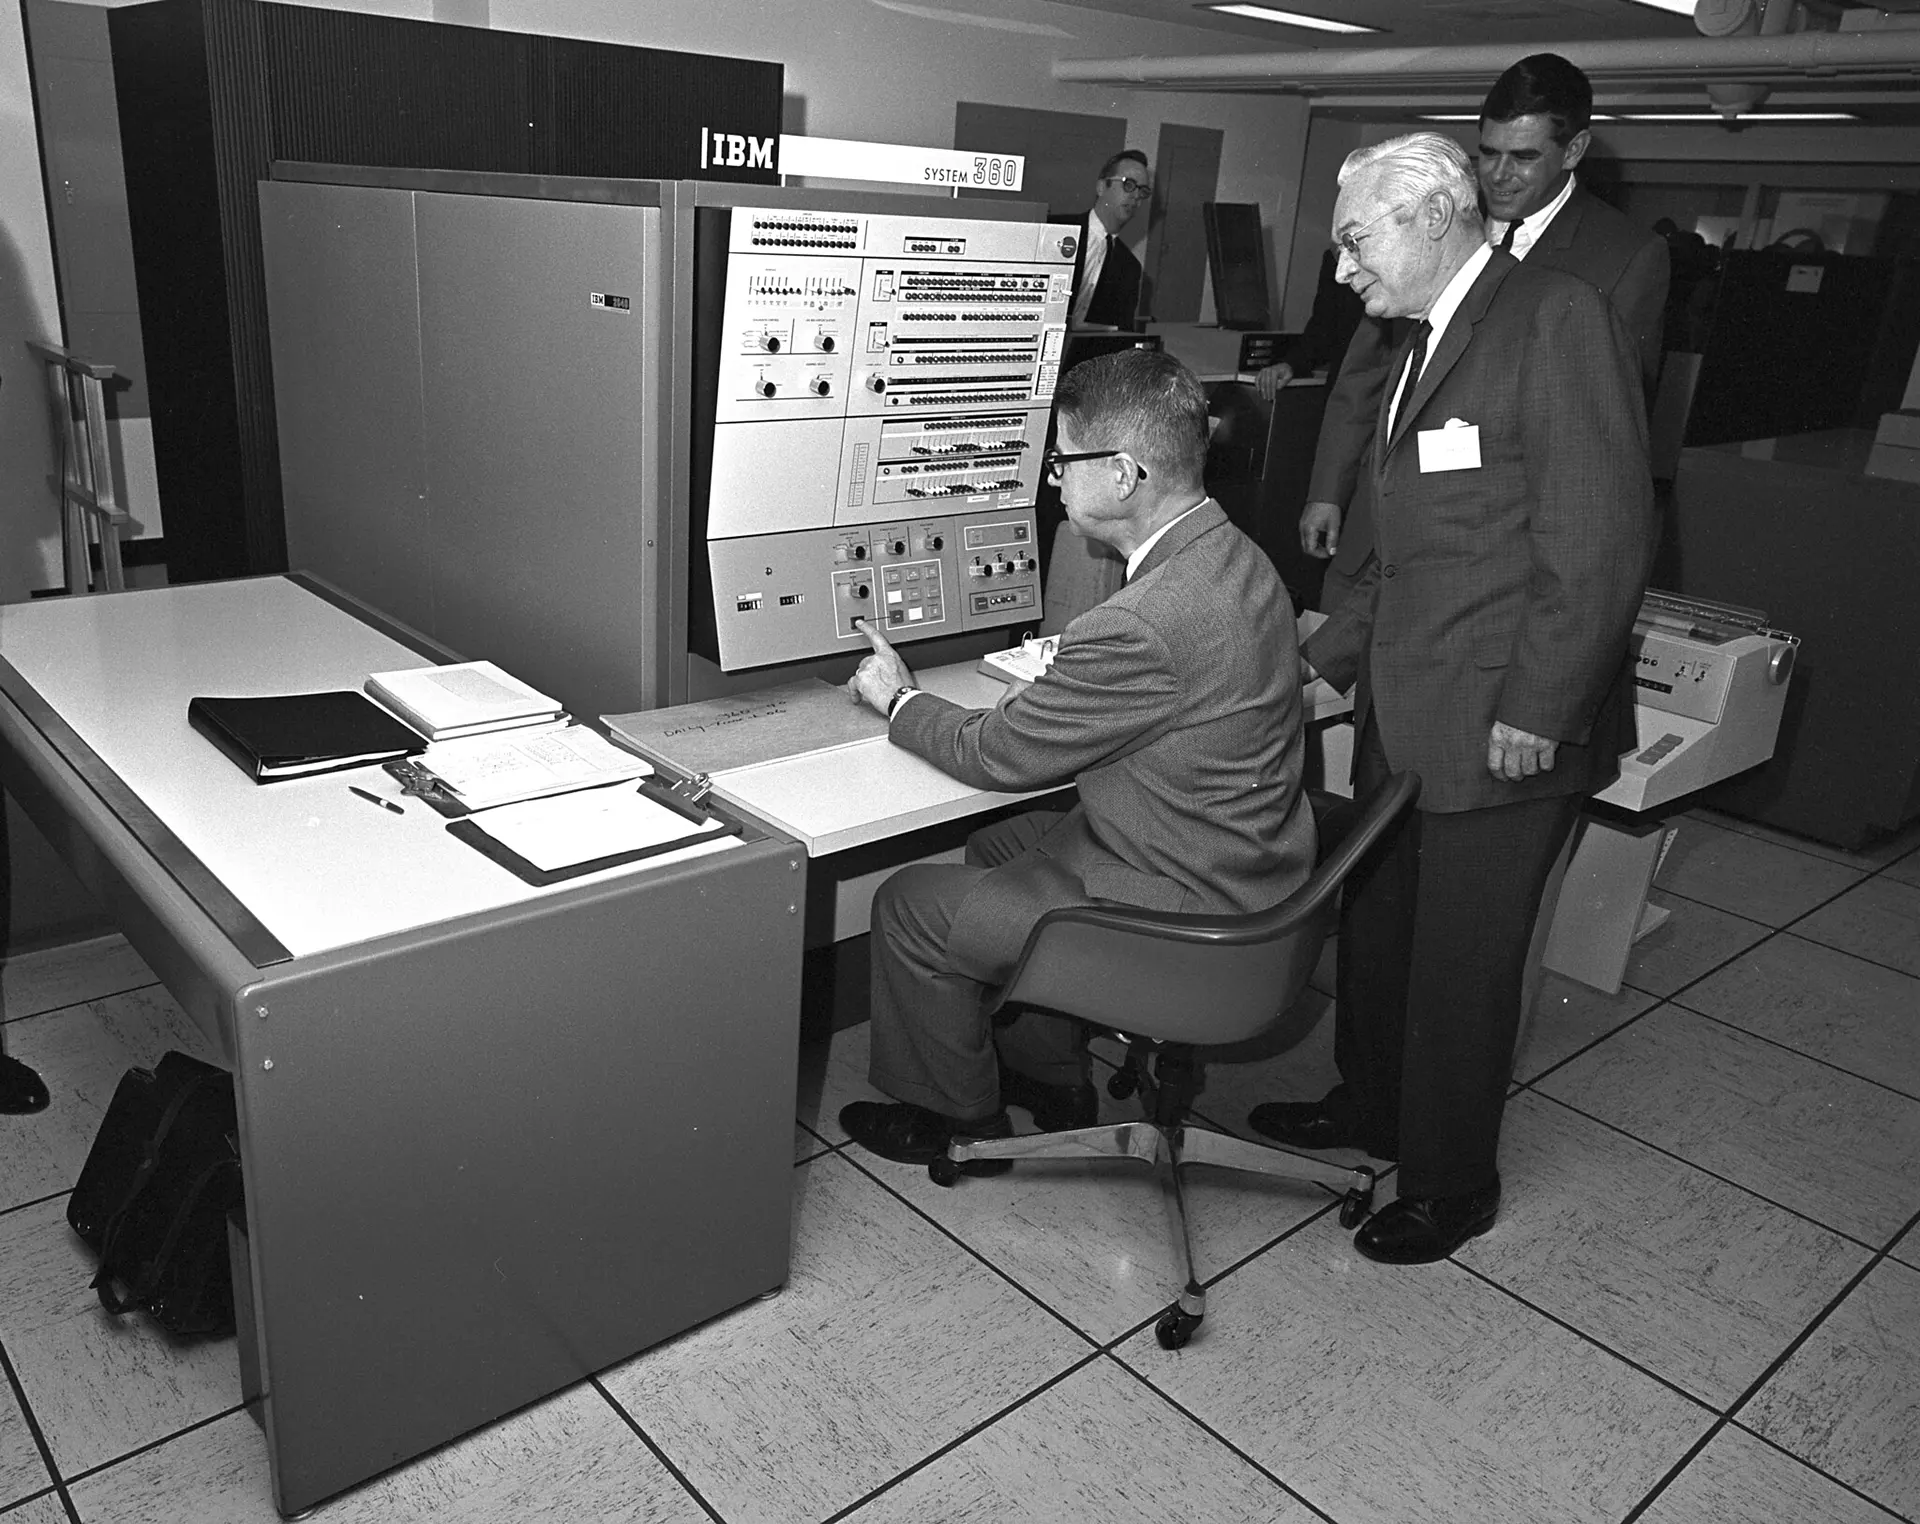
IBM System/360 mainframe at the opening of The Washington Data Processing Center (April 1, 1966). Statistical Reporting Service of USDA Administrator Harry Trelogan looks on as Agriculture Secretary Orville Freeman tests out some of the functions. Photo courtesy of the National Archives and Records. Source: US Department of Agriculture Flickr
Key hardware elements for early database management included:
- Magnetic tape drives for sequential backups and bulk data archiving.
- DASDs (Direct Access Storage Devices) for fast, random access to structured data.
- Punched cards and paper tape as legacy media for data entry and programs.
- Terminals such as the IBM 2260 and Univac Uniscope, which enabled full-page interaction and gave users real-time access to enter, correct, and visualize data.
B43_DBMS_HARDWARE
B44_SABRE_SYSTEM
System/360 architecture created a common platform where storage devices, terminals, and software could work together. For business computing, the change was decisive: data handling moved from overnight reports to interactive use on screens.
Once users could enter, correct, and query records directly, processing unfolded through continuous exchanges between people and systems. This became the foundation for real-time applications.
B44_SABRE_SYSTEM

SABRE — The First Real-Time Business System
In the late 1950s, a spontaneous meeting between IBM and American Airlines executives on a flight sparked the idea for a computerized reservation system. Drawing from IBM’s military experience with the SAGE air defense system, the two companies built SABRE — the Semi-Automated Business Research Environment.
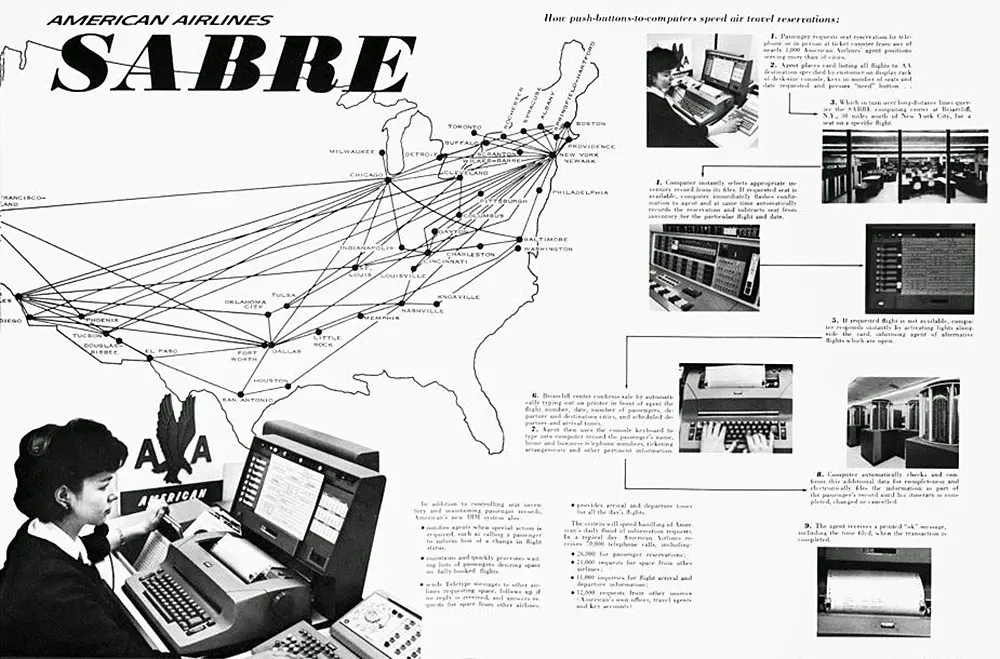
American Airlines SABRE advertisement showing the network of its computerized reservation system (late 1960s). Source: Tails Through Time
Launched in 1960, SABRE became the world’s first commercial real-time data system, handling 83,000 bookings per day via two IBM 7090 mainframes. Its interactive model allowed agents to check seat availability, confirm tickets, and update records instantly, replacing manual booking processes.
B44_SABRE_SYSTEM
B45_OLYMPICS_DB
More than a tool for booking flights, SABRE became a template for real-time systems. Its design showed that records could be updated continuously and shared instantly across a network — a model soon echoed in banking, finance, and logistics.
B45_OLYMPICS_DB

Tokyo Olympics 1964 — Real-Time on a Global Stage
The 1964 Tokyo Olympics posed a monumental data challenge: 7,000 athletes, 100 countries, and up to 25 simultaneous contests across 32 venues. To manage this, IBM Japan deployed a real-time data processing system that transformed event coordination forever.
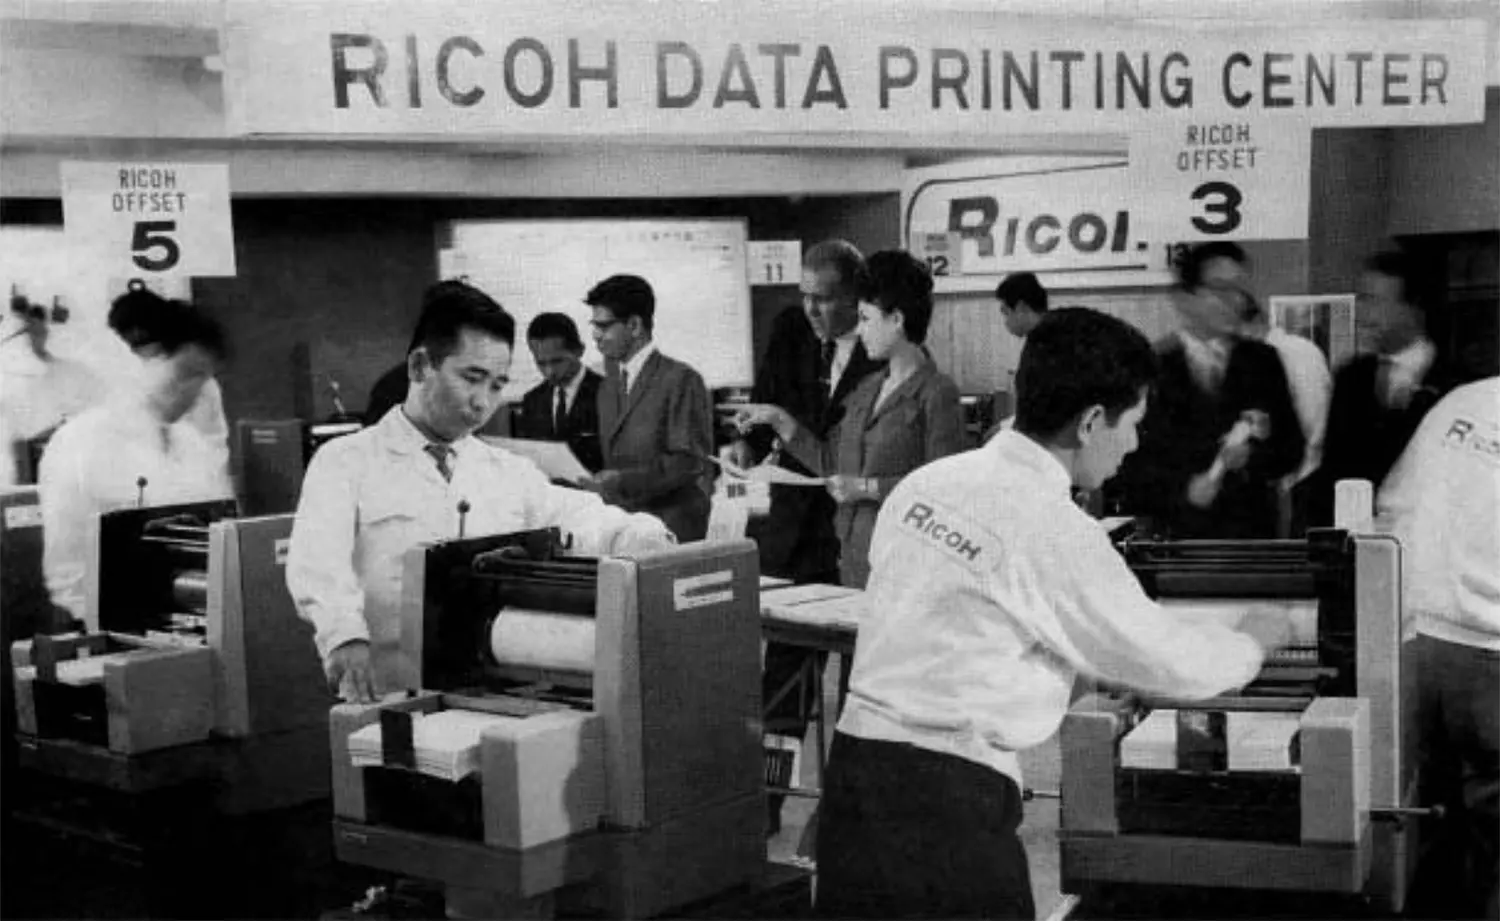
Data-printing center in the Olympic Village, Tokyo (1964). Source: Official Games Report
Using 62 IBM 1050 terminals across venues, scores were sent to a central Olympic Data Center powered by eight IBM computers. With a disk capacity of 56 million characters, the center processed rankings, judge scores, and registration data for 12,000 participants — within seconds. Over 100,000 messages were expected, with three to four times as many replies sent back.
B45_OLYMPICS_DB
Cluster B5
SABRE proved that continuous data flows could manage a service industry, while Tokyo Olympics showed that the same logic could coordinate global events. Together they marked a turning point: computing was no longer producing reports after the fact, but sustaining transactions and interactions as they happened.
Processing had become infrastructure — the nervous system through which organizations, and soon societies, would operate.
B5
Foundations of Data Handling
As computing spread through business and government in the 1960s, the challenge was no longer simply to store or transmit information. It was to decide how data should be processed.
Should jobs be collected and run in long, efficient batches, or should systems respond immediately to events as they happened? The answers produced different architectures, each with its own strengths, costs, and trade-offs. The contrast between batch and online processing defined the foundations of modern data handling.
B51_BATCH_VS_OLTP

Batch vs. Online Processing — From Census to Seats
By default, early computing relied on batch processing — collecting data over hours or days, then feeding it into a system for a single, uninterrupted run. This was ideal for repetitive, large-scale jobs like payroll or census tabulation. The method emphasized efficiency in an era when computer time was scarce and expensive.
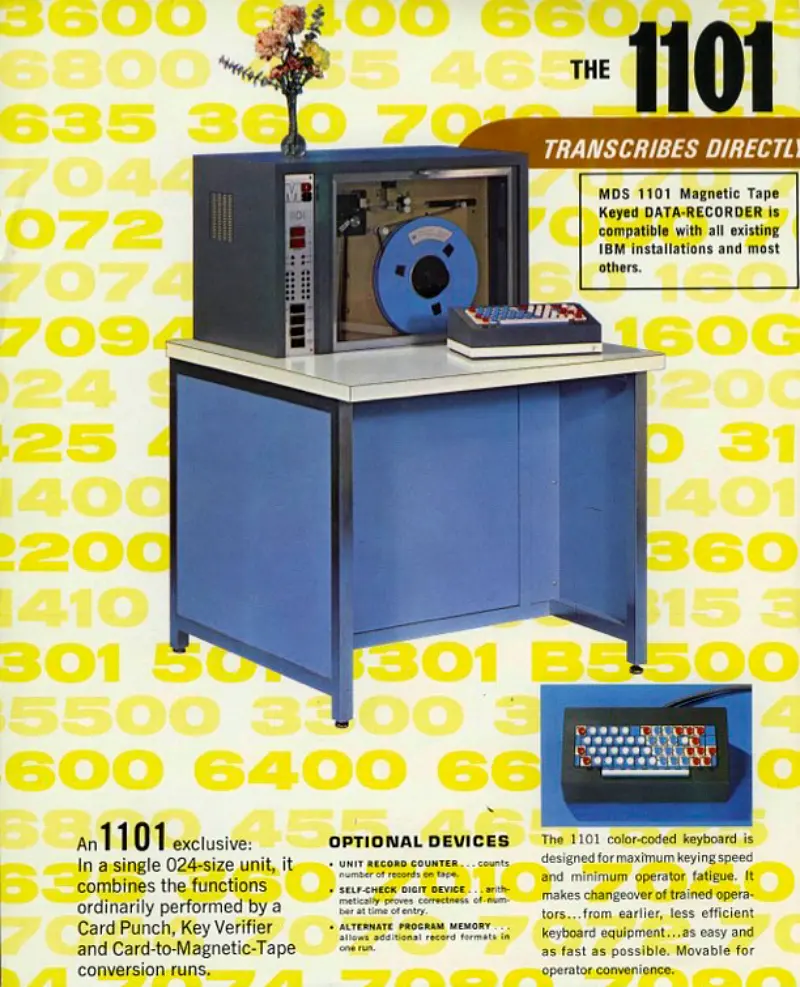
Brochure page for the 1101 Keyed Data Recorder, Mohawk Data Science Corporation (1965). Source: Internet Archive
The shift to Online Transaction Processing (OLTP) enabled systems to handle data in real time, allowing for immediate response to user input. The change was made possible by new magnetic disks (offering random access), faster processors, and networked terminals.
B51_BATCH_VS_OLTP
B52_DATA_INTEGRITY
The arrival of online transaction processing redefined what computing meant. Data was no longer processed in blocks after the fact but managed as it happened, one transaction at a time. That shift created the architecture of modern systems: continuous, interactive, and responsive.
OLTP became a cornerstone of data handling — but once transactions were live, new questions followed. How could records stay consistent across departments? How could errors be prevented before they spread? Real-time processing made data powerful, but it also made integrity essential.
B52_DATA_INTEGRITY

Data Integrity — Redundancy, Consistency, and Security
In the early years of digital computing, businesses faced a fundamental problem: data was everywhere, and nowhere unified. The same customer’s name or address might live in multiple departmental files, each updated (or not) independently. This data redundancy consumed storage and bred inconsistency. A change made in sales might never reach accounting or shipping.
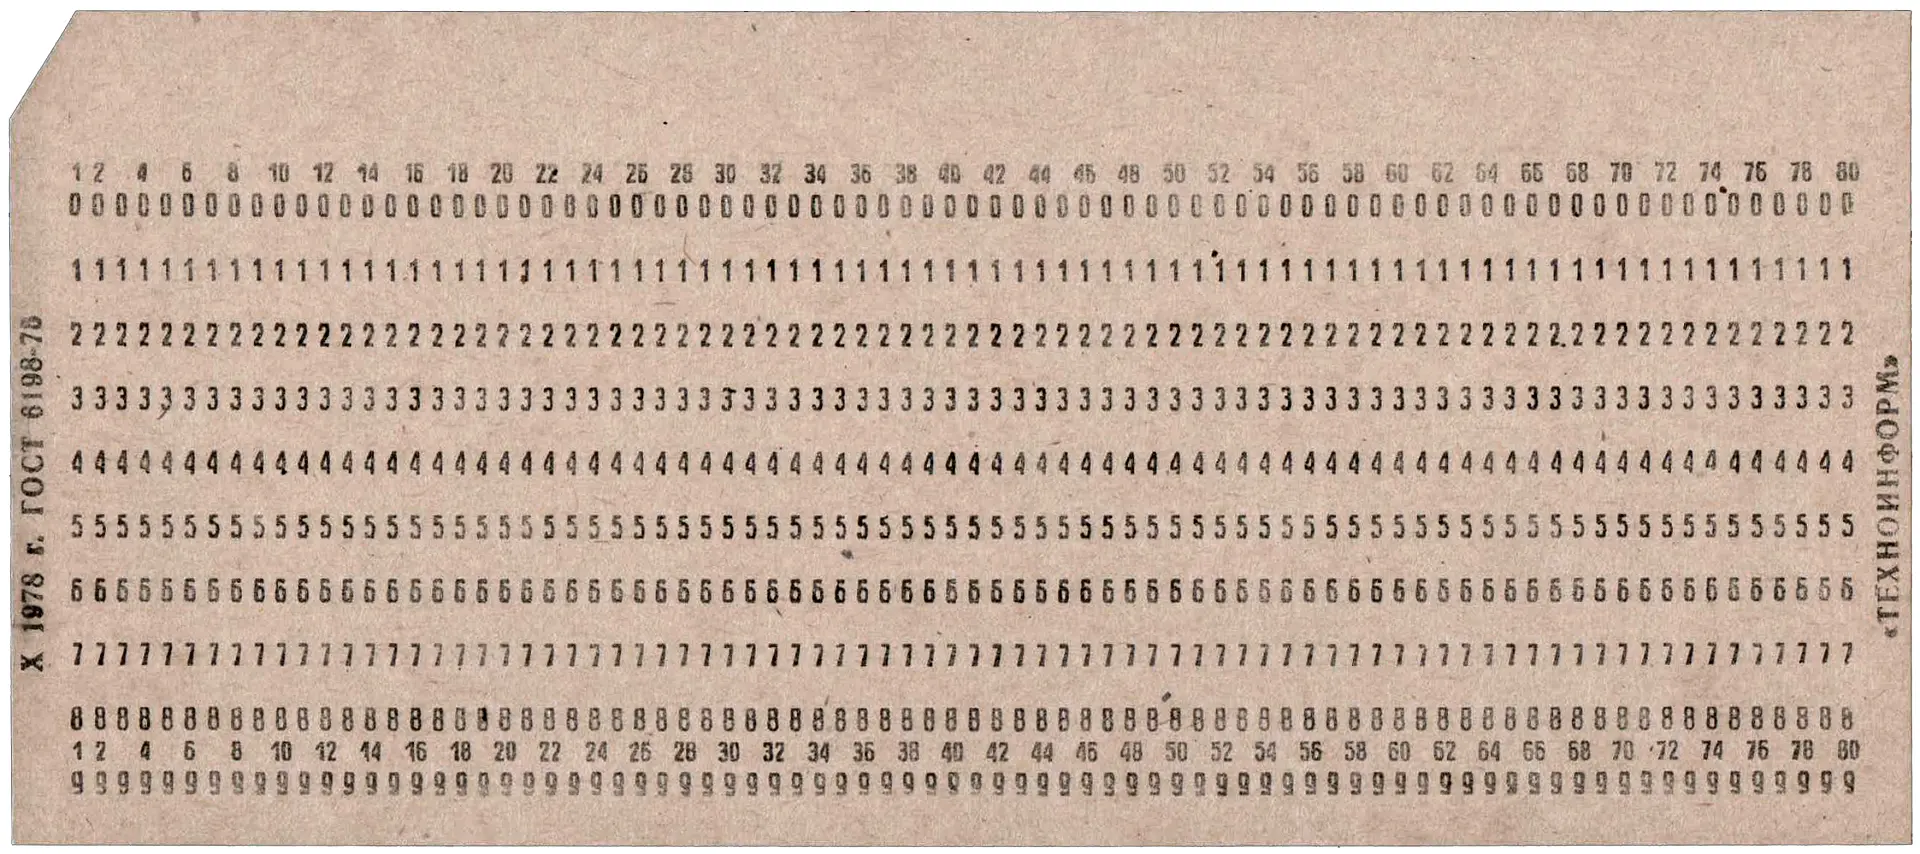
80-column punch card printed at the Tehnoinform facility, Riga, USSR (1976). Source: Tristan Davey’s Punchcard Archive
The emergence of Database Management Systems (DBMS) in the 1960s — such as GE’s IDS and IBM’s IMS — centralized data storage, enabling multiple applications to access the same version of a record.
Centralization also raised the stakes. Errors in one place could propagate everywhere, making data integrity critical: records had to be valid, correct, and complete. Fields were expected to follow strict rules — for example, prices had to be numeric and dates had to conform to valid calendar values. As data became more valuable, concerns about security also grew.
B52_DATA_INTEGRITY
B54_EARLY_INTERFACES
Redundancy, consistency, integrity, and security became the pillars on which modern data systems were built. Every entry had to be checked, every rule enforced, every access controlled.
These principles made data processing trustworthy enough to scale — but they also underscored how technical and mediated the act of using a computer still was. The question of who could interact with these systems, and how, was becoming just as important as the data they safeguarded.
B54_EARLY_INTERFACES

Early Interfaces — Command Lines and Control Panels
Early computers didn’t greet users with icons or buttons. Interaction meant command-line precision, punched card stacks, and binary switches. Human–machine communication was intense, physical, and deeply technical.
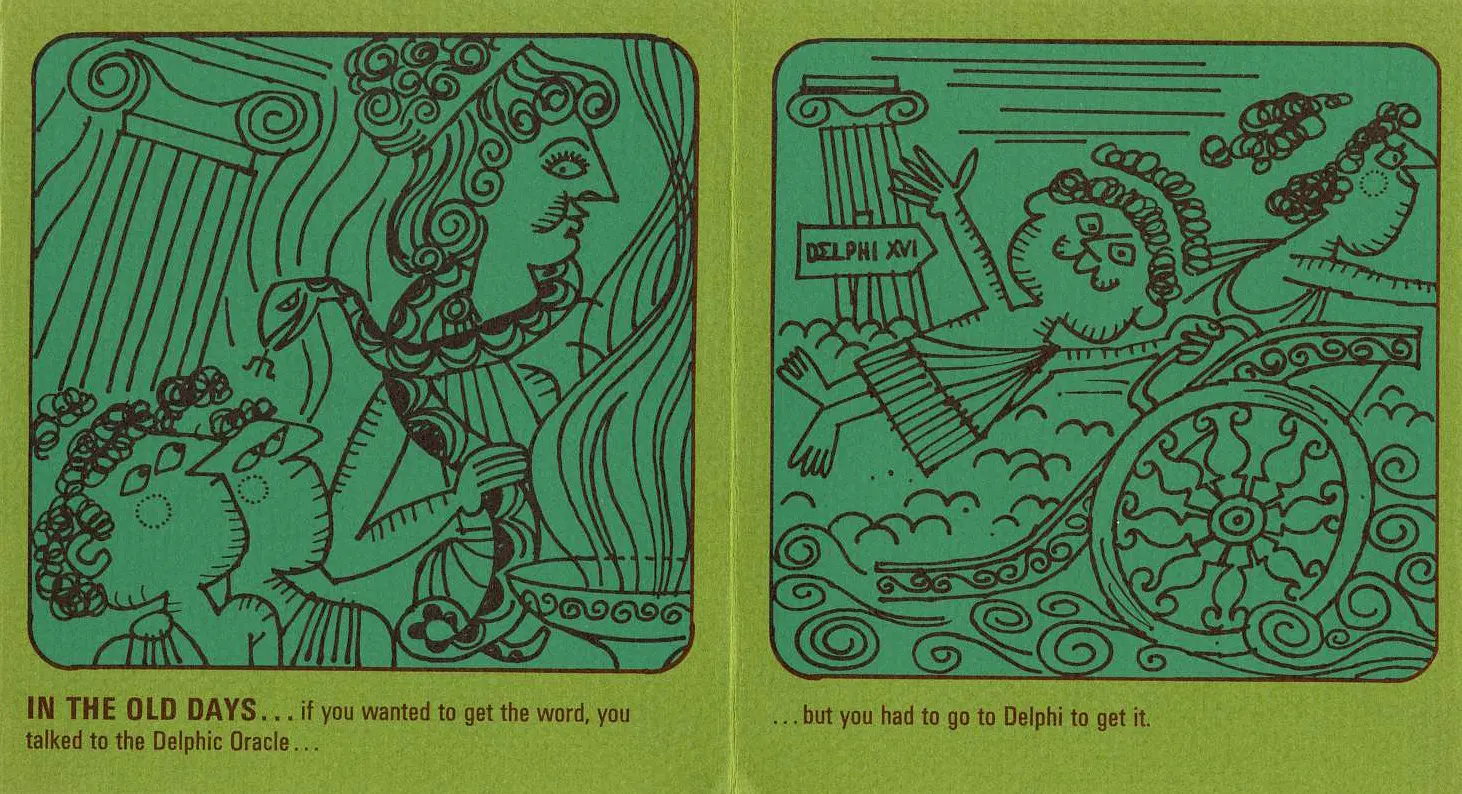
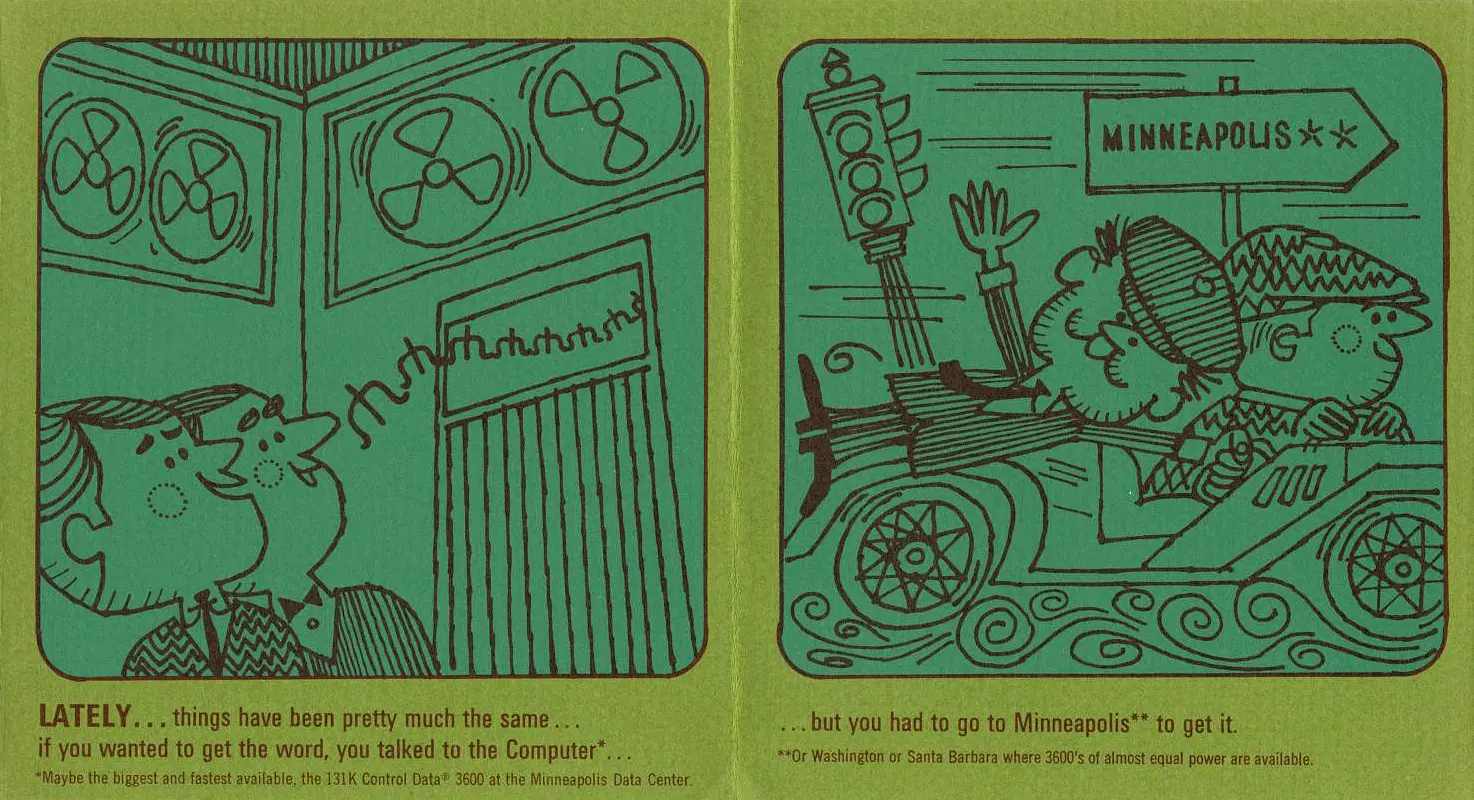
“A Fable for Computer Users,” Control Data Corporation booklet, 1960s. Source: Internet Archive.
“A Fable for Computer Users,” Control Data Corporation booklet, 1960s. Source: Internet Archive.
Users were mostly operators, engineers, and programmers — not everyday clerks or analysts. Programs were written in machine code or assembly, entered via punch cards or front-panel switches. The idea of a “user-friendly” system simply didn’t exist.
Control panels featured toggle switches, status lights, and manual overrides. Later came command line interfaces (CLIs), where users had to type exact instructions. A single typo could crash an entire batch run.
To improve efficiency, Job Control Languages (JCLs) emerged — scripts that told the computer what to do, in what order, and how to handle results. This was automation before the GUI.
Meanwhile, efforts to standardize peripheral interfaces, data formats, and operating procedures foreshadowed the shift toward interoperable systems. Symbolic abstractions like mnemonic codes pointed toward usability, but the user was still a technician, not a typist.
B55_EARLY_STRUCTURES_ALGOS
Organizing Information — Data Structures and Algorithms
While interfaces determined how people spoke to machines, the machines themselves needed internal structures to manage information once it was loaded. Early programmers discovered that efficiency depended not only on commands, but on how data was arranged in memory.
The first systematic solutions were data structures. Arrays assigned each item to a fixed slot in memory, like numbered positions in a filing cabinet — quick to access but inflexible. Linked lists, by contrast, let each record point to the next, forming a chain that could grow or shrink as needed. Together, they gave programmers reliable ways to store and retrieve data on machines with limited resources.
Processing required algorithms — step-by-step procedures for sorting, searching, or merging records. A payroll system, for example, depended on routines to alphabetize employees or locate specific names. These instructions were hard-coded in assembly or other low-level languages, demanding technical skill to write and maintain.
Later, thinkers such as Donald Knuth and Niklaus Wirth codified these ideas in textbooks and programming languages, ensuring that structures and algorithms became the foundation of computer science education and practice.
B55_EARLY_STRUCTURES_ALGOS
Supercluster C
The foundations of data handling took shape in practices that rarely made headlines: the choice between batch and online transactions, the push to keep records consistent, the unforgiving interfaces, and the coded routines that organized information in memory. Each solved immediate technical problems, but together they defined what it meant to process data reliably.
By the end of the 1960s, computing had become less about individual machines and more about the principles that made systems trustworthy and usable.
The Relational Model of Databases — Logic, Language, and Independence
Database management systems (DBMSs) emerged as tools of control and as symbols of computing’s rising managerial role. As historians Bergin and Haigh observe, they marked the moment when data itself was framed as a corporate resource. Media theorist Lev Manovich later noted how DBMSs encouraged people to treat information as structured and purposeful rather than as a random collection of records.
The first commercial packages, IBM’s IMS and Cullinane’s IDMS, made this shift tangible. They centralized large bodies of business and government data, but they remained tied to the logic of specific machines and programs. Changing a data structure often meant breaking the applications built on top. The unresolved problem was how to separate data from the hardware and code that handled it.
It was into this setting that Edgar F. Codd introduced the relational model.
C1
Codd and the Relational Revolution
The most influential challenge to existing databases came from inside IBM. In the late 1960s, as the company was consolidating its System/360 empire, one of its researchers argued that the whole foundation of data management was flawed. Edgar F. Codd proposed that information should be understood as elements in a formal system that could be reasoned about independently.
In 1970 his paper in Communications of the ACM set out the principles of a relational approach, sparking debates that would reshape both theory and practice. The relational revolution began not with hardware or code, but with an argument on paper.
C11_CODD_RELATIONAL

The Relational Breakthrough — Codd’s 1970 Paper
After serving as a WWII pilot, Edgar F. Codd returned to Oxford for a mathematics degree and later joined IBM in the U.S. In the 1960s, he developed software for the IBM 7090 mainframe — systems deeply tied to physical data structures. At IBM’s research lab in San Jose, California, he advanced a new idea: databases should represent information using only data values, not pointers, hierarchies, or physical record order.
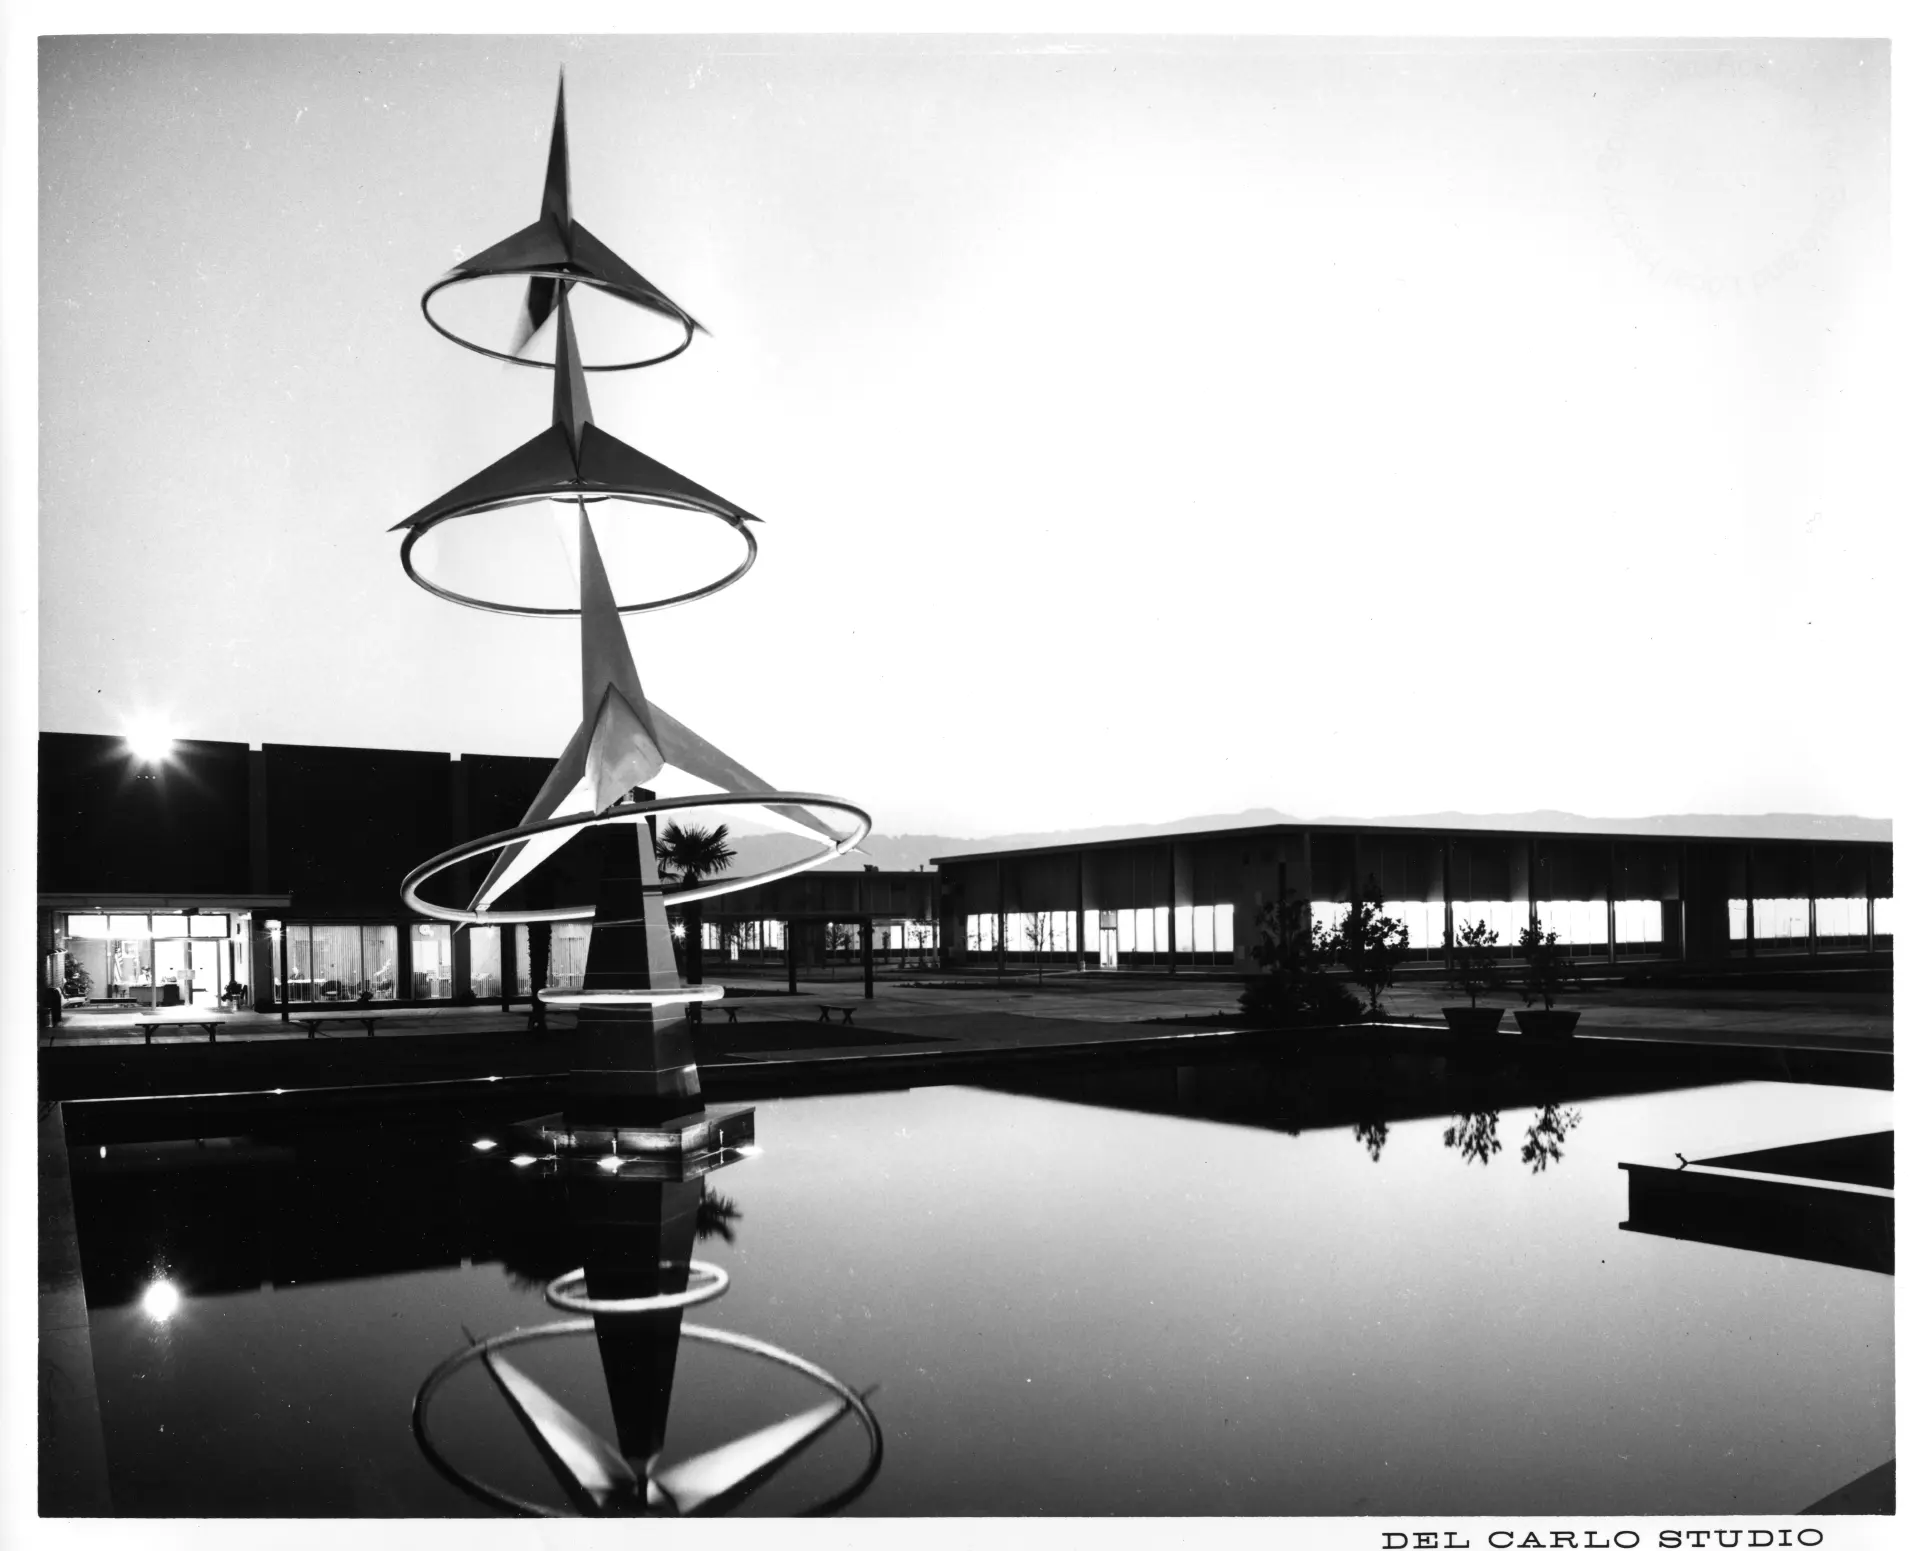
IBM San Jose Research Lab, Building 25, designed by John Savage Bolles (1958). Photograph by Arnold Del Carlo. Codd developed the relational model here, in a hub of exploratory research at IBM. Source: Smith-Layton Archives at the Sourisseau Academy for State and Local History, San Jose State University
His 1970 paper, A Relational Model of Data for Large Shared Data Banks, introduced the concept of data independence — separating logical data relationships from how data is physically stored. This allowed users to pose declarative queries without understanding the internal structure. It laid the foundation for SQL and shifted database design from hardware-bound logic to abstract, high-level models.
Although the mathematical style puzzled many readers — even IBM engineers admitted they “couldn’t make heads or tails” of it — the paper defined a new direction for database research. In 1981, Codd received the Turing Award for this contribution.
C11_CODD_RELATIONAL
C12_RELATIONAL_HARDWARE
The challenge Codd addressed was deeper than hardware or software compatibility. Those could be standardized through engineering fixes and corporate agreements. The harder problem was the data itself.
Early hierarchical systems buried information inside rigid formats, making it difficult to share, extend, or reorganize. Codd’s model separated data from the programs that processed it, so that meaning could stand apart from machinery. That separation turned a technical proposal into a conceptual break — and a new horizon for how information could be structured and used.
C12_RELATIONAL_HARDWARE
IBM Context — Hardware First, Ideas Later
Codd’s work on the relational model was rooted in IBM’s dramatic hardware evolution. In the early 1960s, he worked with the IBM 7090, a transistorized mainframe widely used for scientific and business computing. Bulky by today’s standards, it nonetheless laid the groundwork for systematizing data operations.
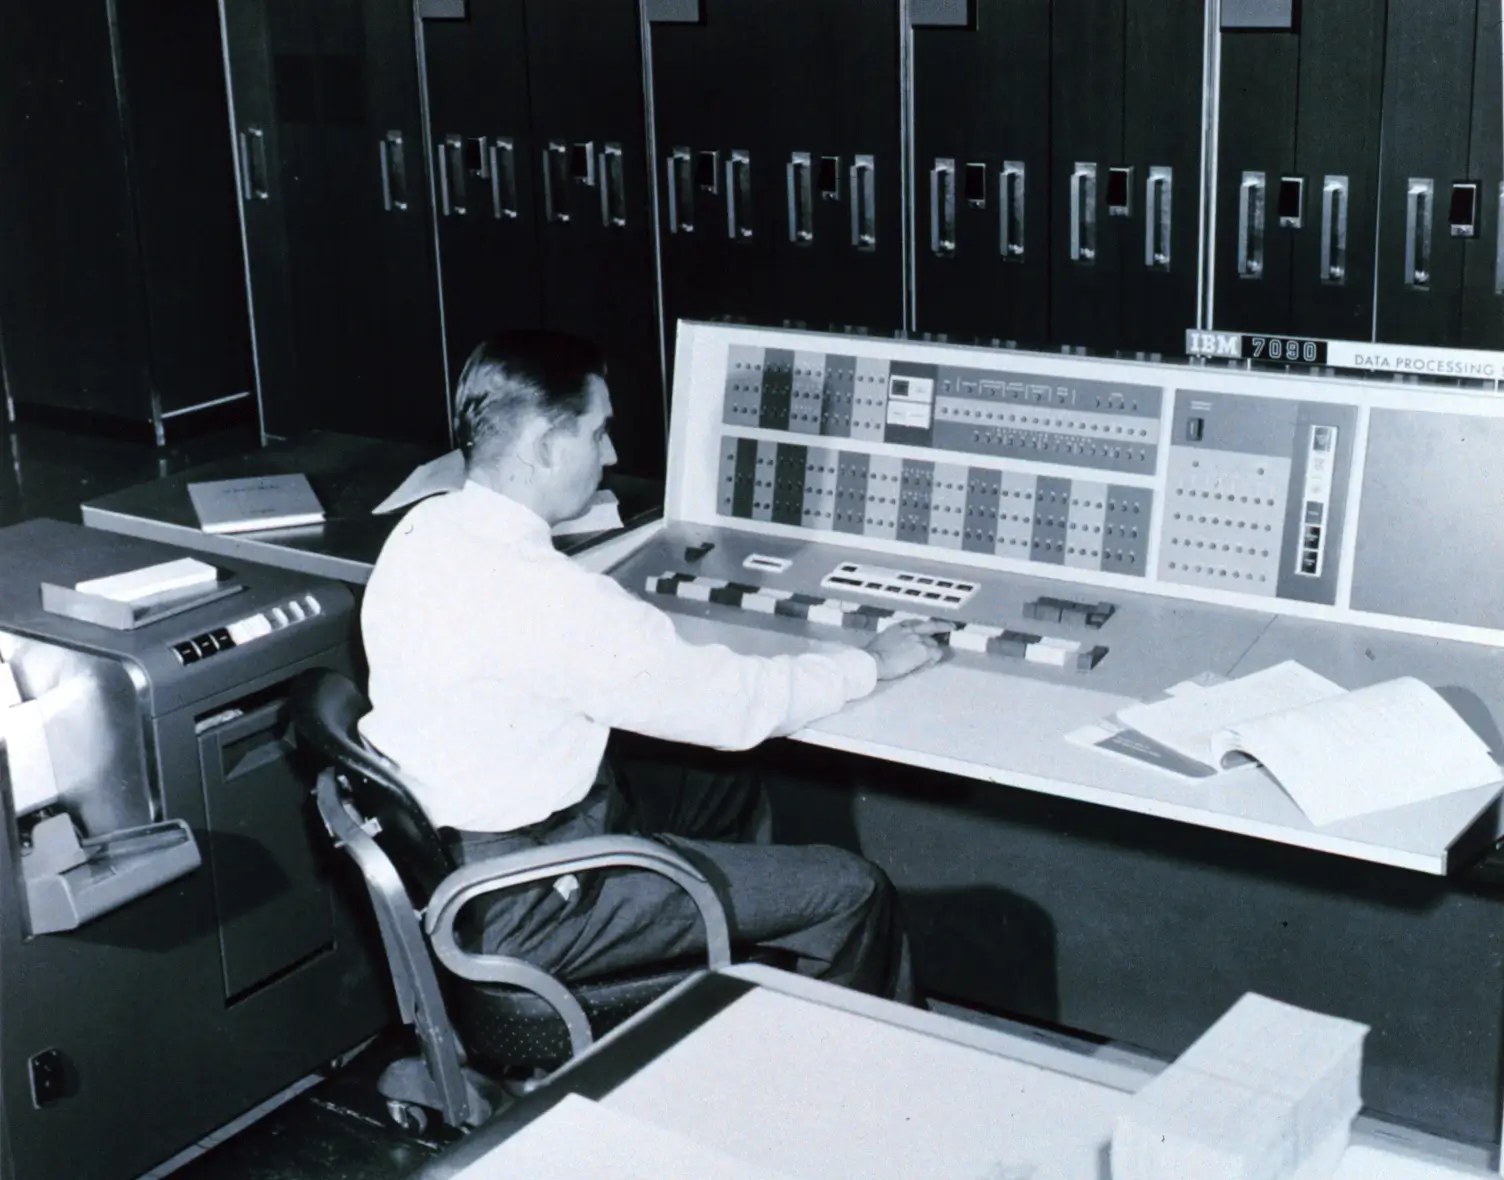
A meteorologist at the console of the IBM 7090 electronic computer in the Joint Numerical Weather Prediction Unit, U.S. Weather Bureau (c. 1965). The 7090 underpinned early business computing and formed part of Codd’s working environment. Source: National Oceanic and Atmospheric Administration
By the late 1960s, IBM introduced the System/360, a platform that unified architectures for business and scientific applications. Its design brought direct-access storage devices (DASDs) — a crucial step toward random-access data retrieval and, eventually, relational systems.
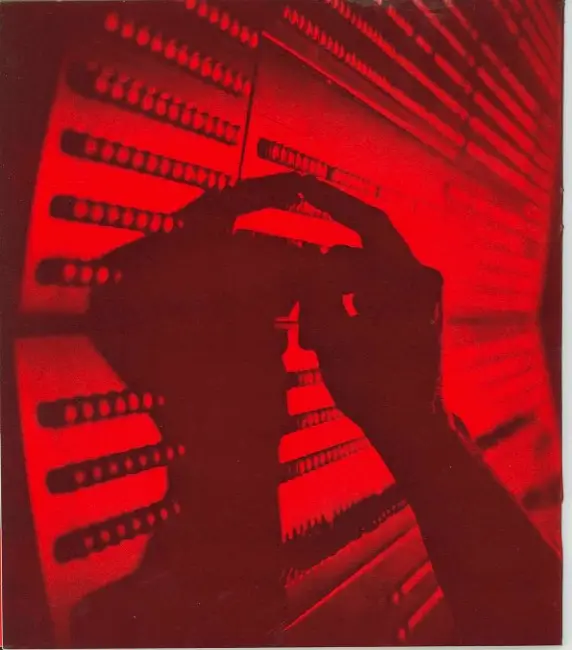
Page with mainframe console image from the IBM System/360 sales brochure (1964). The 360 symbolized scalable computing — groundwork for relational systems in business. Source: Computer History Museum
Codd’s vision explicitly abstracted away hardware dependence, promoting logical organization over machine constraints.
C12_RELATIONAL_HARDWARE
C13_RELATIONAL_HONEYWELL
Yet independence could not stand on logic alone. Without addressable disks and faster CPUs, the relational model might have remained a paper exercise. The hardware context made it feasible, but IBM’s culture kept it theoretical. Bound to the System/360 business model, the company hesitated to push an idea that threatened established practices.
That left space for others to act. Honeywell’s MRDS would become the first real demonstration that relational systems could work outside the lab — and outside IBM’s control.
C13_RELATIONAL_HONEYWELL

MRDS on Multics — The First Relational System
In the mid-1970s, the Multics Relational Data Store (MRDS) became the first commercial implementation of Codd’s relational model. At Honeywell’s Phoenix facility, Jim Weeldreyer and Oris Friesen led its development, drawing on Codd’s theoretical framework while working in parallel with early relational projects such as IBM’s System R and Berkeley’s Ingres.
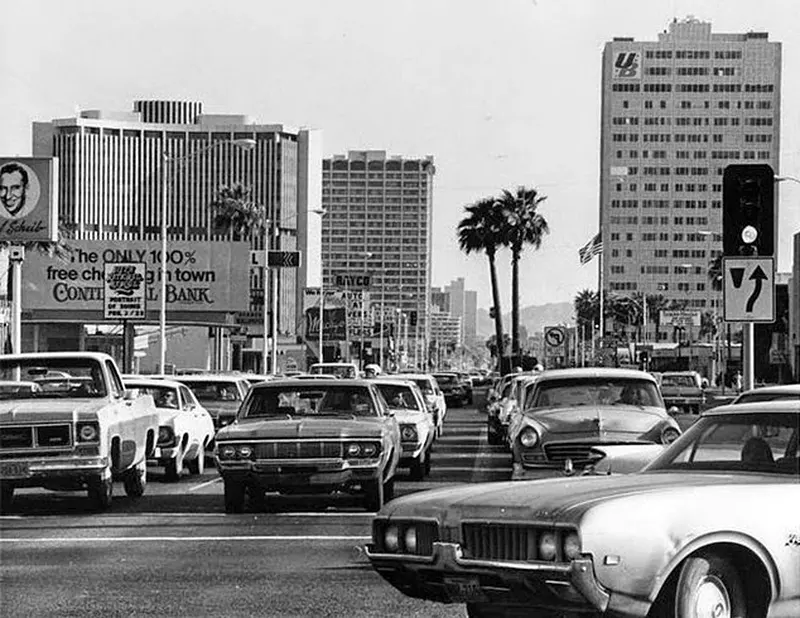
Midtown Phoenix, Arizona (1970s). Honeywell’s Phoenix facility developed MRDS here, an early hub of relational database innovation. Source: Rogue Columnist
Running on the secure, time-sharing Multics operating system, MRDS took advantage of virtual memory and was written in PL/1. Its design allowed users to access and manipulate structured data using high-level relational commands. In 1976, Honeywell marketed MRDS as part of the Multics Data Base Manager (MDBM), which also included a CODASYL-style layer.
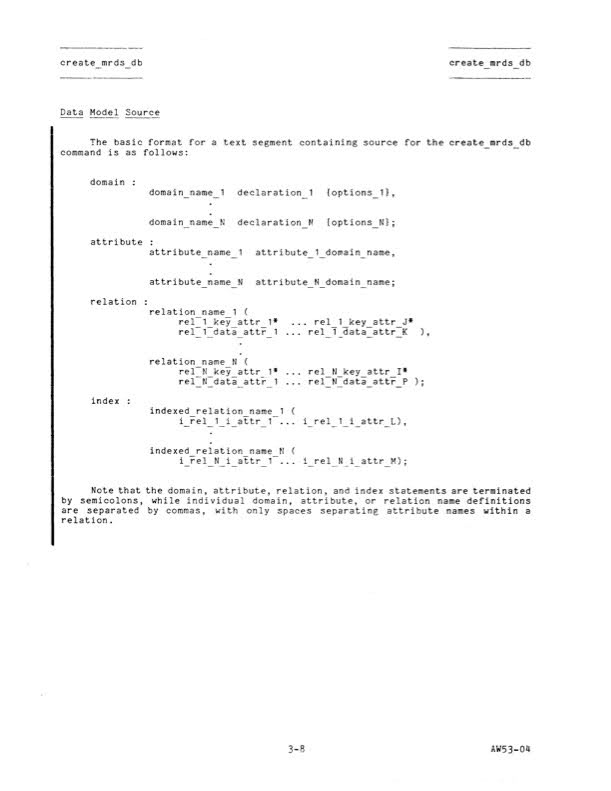
Diagram from the MRDS Manual (1981), showing the Relational Data Source Model — one of the first real-world implementations of relational principles for structured business data. Source: Bitsavers
C13_RELATIONAL_HONEYWELL
Cluster C2
Punched card systems changed the scale of data processing. No longer tied to a single loom or census, they became the connective tissue of states and corporations. Civil registries, payrolls, tax records, and inventories all began to flow through standardized cards and tabulators.
Processing here was not invention but normalization — a logic absorbed into institutions until bureaucracy itself depended on it. To see how deep these habits ran, we need to rewind to older traditions of counting, where enumeration was less about machines than about ritual order.
C2
Practical Birth of Relational Databases
If MRDS proved that relational systems could exist, System R asked whether they could thrive. At IBM’s San Jose Research Lab, engineers set out to turn Codd’s theory into working code, complete with language, storage, and performance benchmarks. This shift marked the practical birth of relational databases: from abstract algebra to prototypes, and then from prototypes to industrial trials.
C21_SYSTEM_R_CONCEPT

System R — Bringing the Relational Model to Life
By the mid-1970s, IBM’s San Jose Research Lab launched a bold experiment: could Codd’s abstract relational model actually work in practice? The answer was System R, a prototype designed to show that a relational database could offer full production functionality without sacrificing performance.
The project began in 1974, led by Don Chamberlin, Ray Boyce, Irv Traiger, and Morton Astrahan — though Codd himself watched it from the side. Chamberlin later remarked, “He really didn’t get involved in the nuts and bolts of System R very much. I think he may have wanted to maintain a certain distance from it in case we didn’t get it right. Which I think he would probably say we didn’t.”
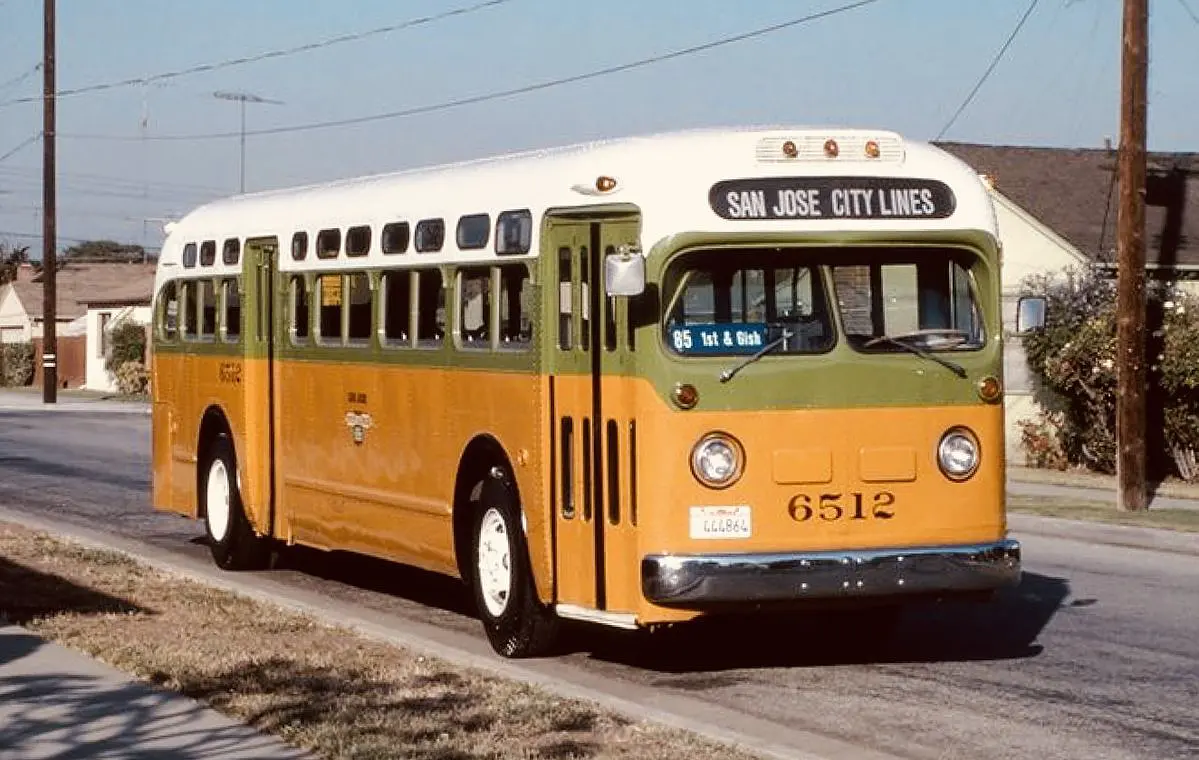
San Jose City Lines bus, GM “Old Look” (early 1970s). IBM engineers commuted past a city in rapid urban transformation. Source
System R unfolded in stages. Phase Zero tested the feasibility of a relational language — SEQUEL (later SQL) — using early prototypes. By 1976, the team had demonstrated SQL’s potential to make databases accessible to non-programmers. Internally, the project split into two groups: the Relational Data System (RDS) focused on language and query logic, while the Research Storage System (RSS) tackled data handling, transactions, and concurrency.
System R was both a proof of concept and a development engine: it validated that a declarative approach to data could scale and laid the groundwork for a new generation of commercial database products.
Cover of the pulp novel The Penetrator #30: Computer Kill (1980) by Lionel Derrick (Chet Cunningham). The story follows a rogue engineer sabotaging banking systems through computers. Published as relational databases entered commercial use, it reflects how data systems were already imagined as both infrastructure and threat. Source: Biblio
C21_SYSTEM_R_CONCEPT
C22_SYSTEMR_USE_CASES
Inside IBM, System R set new patterns for how software could be designed, tested, and extended. What began as an experiment in a research lab became proof that relational logic was fit for industrial practice, and from there it seeded broader trends across computing.
C22_SYSTEMR_USE_CASES

Real-World Trials — System R in Industry
In the late 1970s, IBM partnered with real-world users to validate the relational model’s performance in live environments. The first major test came in 1977, when Pratt & Whitney, a jet engine manufacturer, used System R to manage parts and inventory.
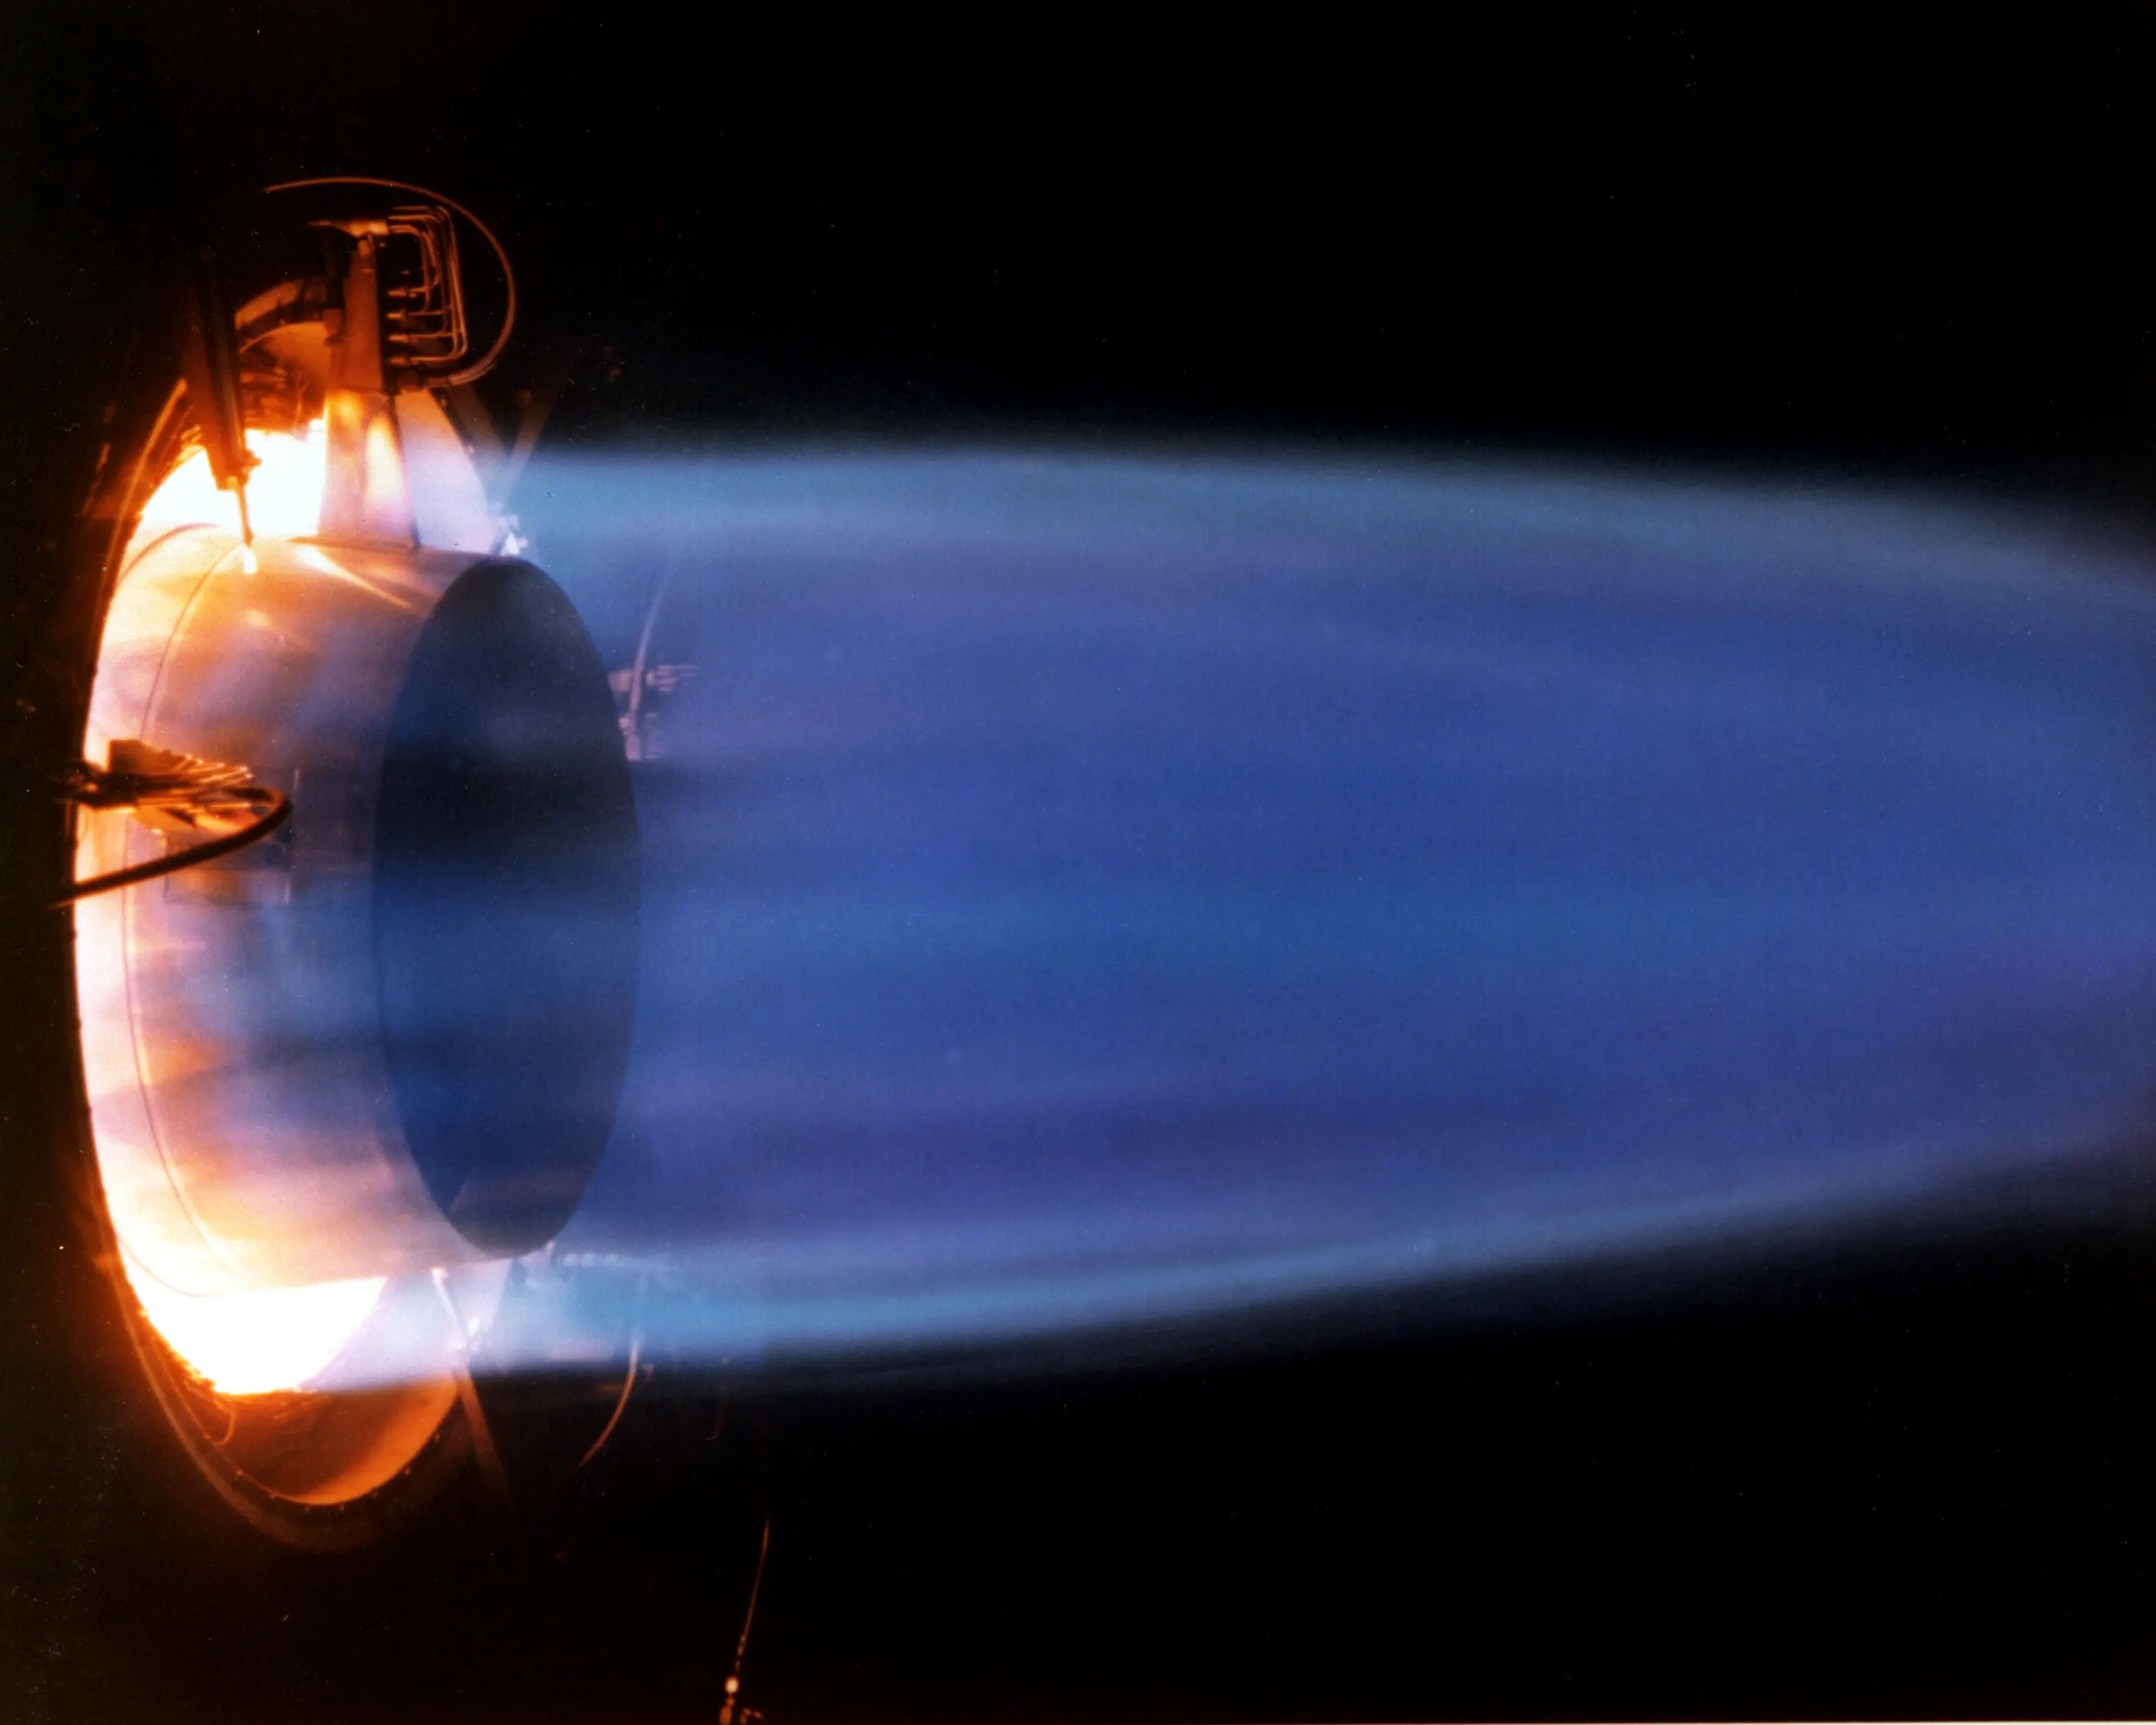
Pratt & Whitney Aircraft duct burner (1979). System R tracked fine-grained logistics during jet engine assembly, ensuring no parts were left behind. Source: NASA / Glenn Research Center Collection
Shortly after, Upjohn Pharmaceuticals deployed it to track clinical research data for FDA applications. While these early adopters didn’t leverage features like concurrency, locking, or transactions to their fullest, they proved relational systems could serve serious industrial use cases.
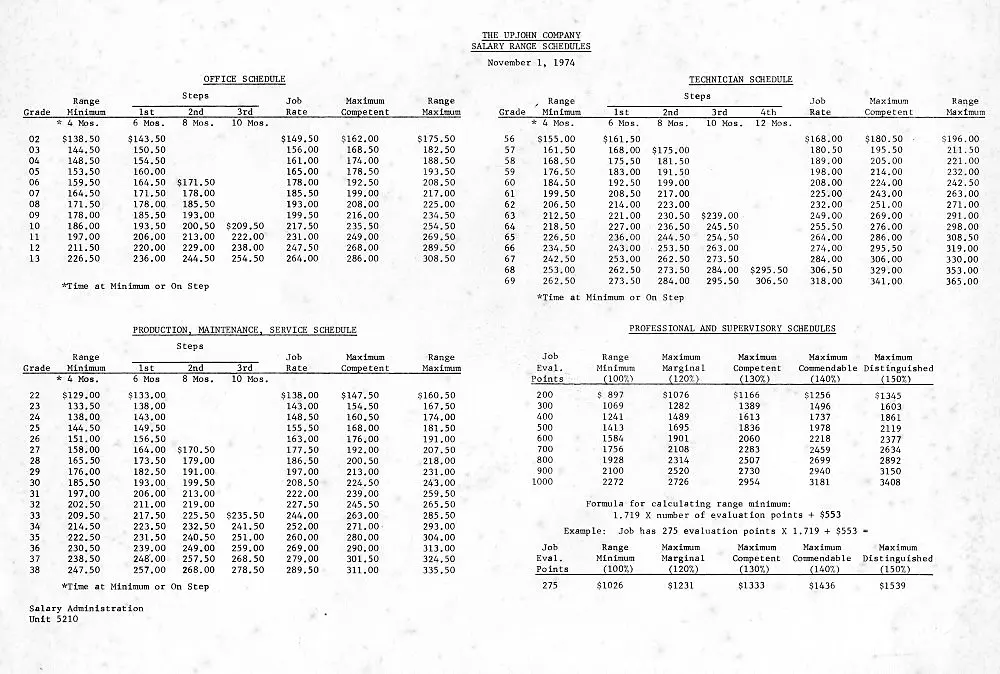
Upjohn compensation formula table (late 1970s). The company stored experimental data in System R during clinical trials. Source: Corporate archival material
Among the growing pains IBM engineers faced was the “Halloween Problem,” discovered on October 31, 1976. Updates to a table could cause rows to re-enter a scan and be modified repeatedly — a quirk that haunted the SQL optimizer until engineers redesigned update handling. Despite these challenges, the project’s success was undeniable: it laid the groundwork for SQL/DS (1981) and the launch of IBM DB2.
C22_SYSTEMR_USE_CASES
Cluster C3
System R’s field trials shifted focus in database design: the crucial question became how systems shaped the work of those who dealt with them. From this point forward, the future of databases would be defined by usability as much as by engineering.
C3
Practical Birth of Relational Databases
Relational systems required a language that could express requests in everyday terms, turning complex queries into simple statements. Structured Query Language (SQL) became that medium. Compact and declarative, it allowed users to treat data access as a dialogue rather than an engineering task.
By the late 1970s, SQL was ready to move into real business systems — the point where implementation began to define its future.
C32_SQL_IMPLEMENTATIONS

Early Implementations and Common Patterns
IBM prepared SQL for enterprise deployment with SQL/DS (announced in 1981) and DB2 (released in 1983), adapting relational concepts for large-scale business use.
Meanwhile, Oracle — founded by Larry Ellison, Bob Miner, and Ed Oates — seized the opportunity to commercialize relational ideas. Its second release, Oracle V2 in 1979, was the first SQL-based RDBMS available on the market. Built not on IBM’s source code but on published research about System R, it proved that relational design could be replicated and sold outside the labs.
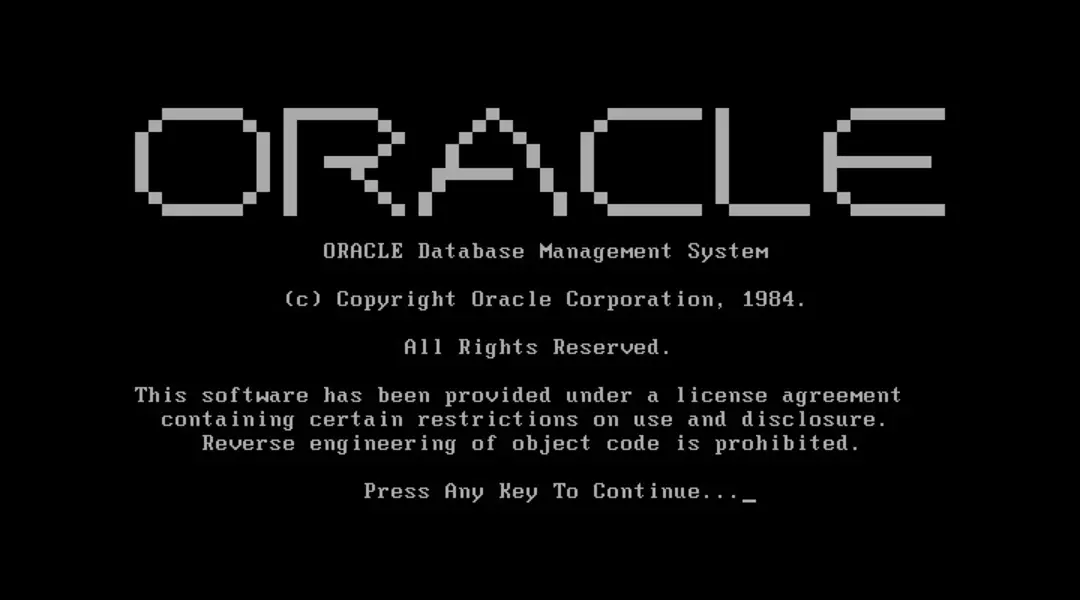
Oracle 4.1 start screen, restored on DOS by Carel Jan Engel and Marco Gralike (2005) — a glimpse of how early SQL-based systems appeared to users. Source
SQL also gained traction in universities, where it was integrated into teaching tools and research systems. Students and researchers learned to write short, declarative statements — a style of interaction that began to define how users expected databases to work.
C32_SQL_IMPLEMENTATIONS
C33_SQL_STANDARDIZATION
The first commercial releases established SQL as a practical foundation for products and research. Multiple vendors and universities built their own versions, which demonstrated its flexibility but also risked fragmentation. Without coordination, SQL could have splintered into dialects tied to individual machines. The next step was to create a shared standard that would hold the field together.
C33_SQL_STANDARDIZATION

SQL Becomes the Standard
In 1986, the American National Standards Institute (ANSI) ratified SQL as the official database language, followed by the International Organization for Standardization (ISO) in 1987. This recognition established SQL as a common interface across vendors and platforms, fixing its role at the core of relational computing.
Federal Information Processing Standards Publication (1986), establishing SQL as a database language. Issued by the U.S. National Bureau of Standards. Source
The first standards, SQL-86 and SQL-89, defined a common core for queries. SQL-92 expanded the scope with features like outer joins, richer data types, and stricter rules of syntax. Later editions — SQL:1999, 2003, and beyond — layered in recursion, triggers, procedural logic, and eventually XML and JSON support, turning SQL into a full-fledged data manipulation language.
The drive toward standardization combined technical aims with commercial strategy. Vendors like IBM, Oracle, and Sybase backed SQL to ease adoption and reduce customer lock-in, even while promoting their own proprietary extensions. Academic systems and open-source projects followed the same path, ensuring that generations of developers learned SQL as a shared skill.
Critics — including Chris Date, one of Codd’s closest collaborators and most influential educators — argued that SQL strayed from relational purity. Yet its adoption was unstoppable: SQL became the de facto language of enterprise computing, not because it was flawless but because it was everywhere.
C33_SQL_STANDARDIZATION
Cluster C4
Standardization gave SQL its authority. Its recognition as a shared interface fixed relational databases at the center of enterprise computing. What followed was the commercial expansion of entire systems built upon it.
C4
Commercial Expansion of Relational Systems
The commercial stage of relational databases demanded proof. Beyond theory and standards, systems had to demonstrate value in real markets, running on actual hardware and supporting everyday business.
Vendors approached this differently: Honeywell tied MRDS to the secure, multi-user world of Multics, while Oracle emphasized portability on smaller, cheaper machines. Competing strategies now defined how relational systems would move from research into industry.
C41_MULTICS_MRDS

Honeywell’s MRDS — The Other First Mover
In June 1976, Honeywell introduced the Multics Relational Data Store (MRDS), the first relational database management system released by a major vendor. Built directly into the Multics operating system, MRDS let users query data through relational algebra and predicate calculus. It coexisted with the Multics Integrated Data Store (MIDS), a hierarchical model, giving organizations a rare choice between competing paradigms.
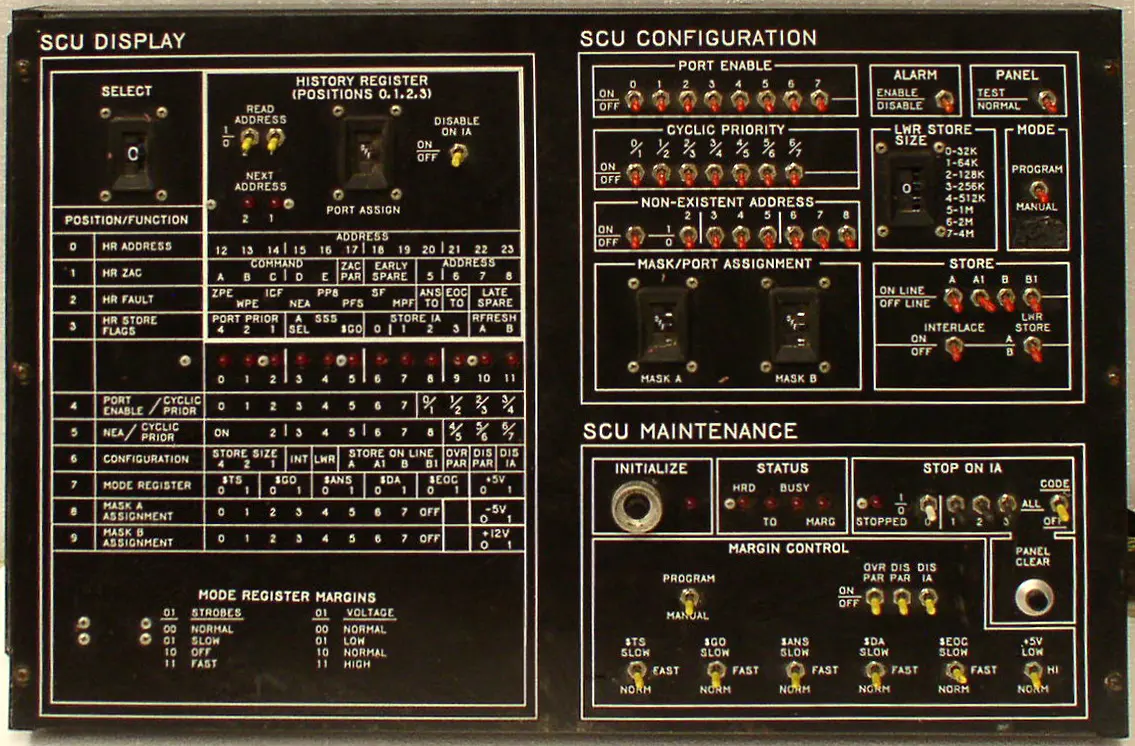
System control panel for Honeywell 6000 series mainframes, the hardware platform supporting MRDS (1980s). Source
Multics’ design emphasized security and multi-user access, qualities that MRDS inherited. Although its reach was limited by Honeywell’s less common Series 60/Level 68 hardware, MRDS showed that relational concepts could be implemented as part of a commercial product.
Frisbee from a Multics company picnic (1968–1980) — a glimpse of the community around Honeywell’s computing projects. Source: Biblio
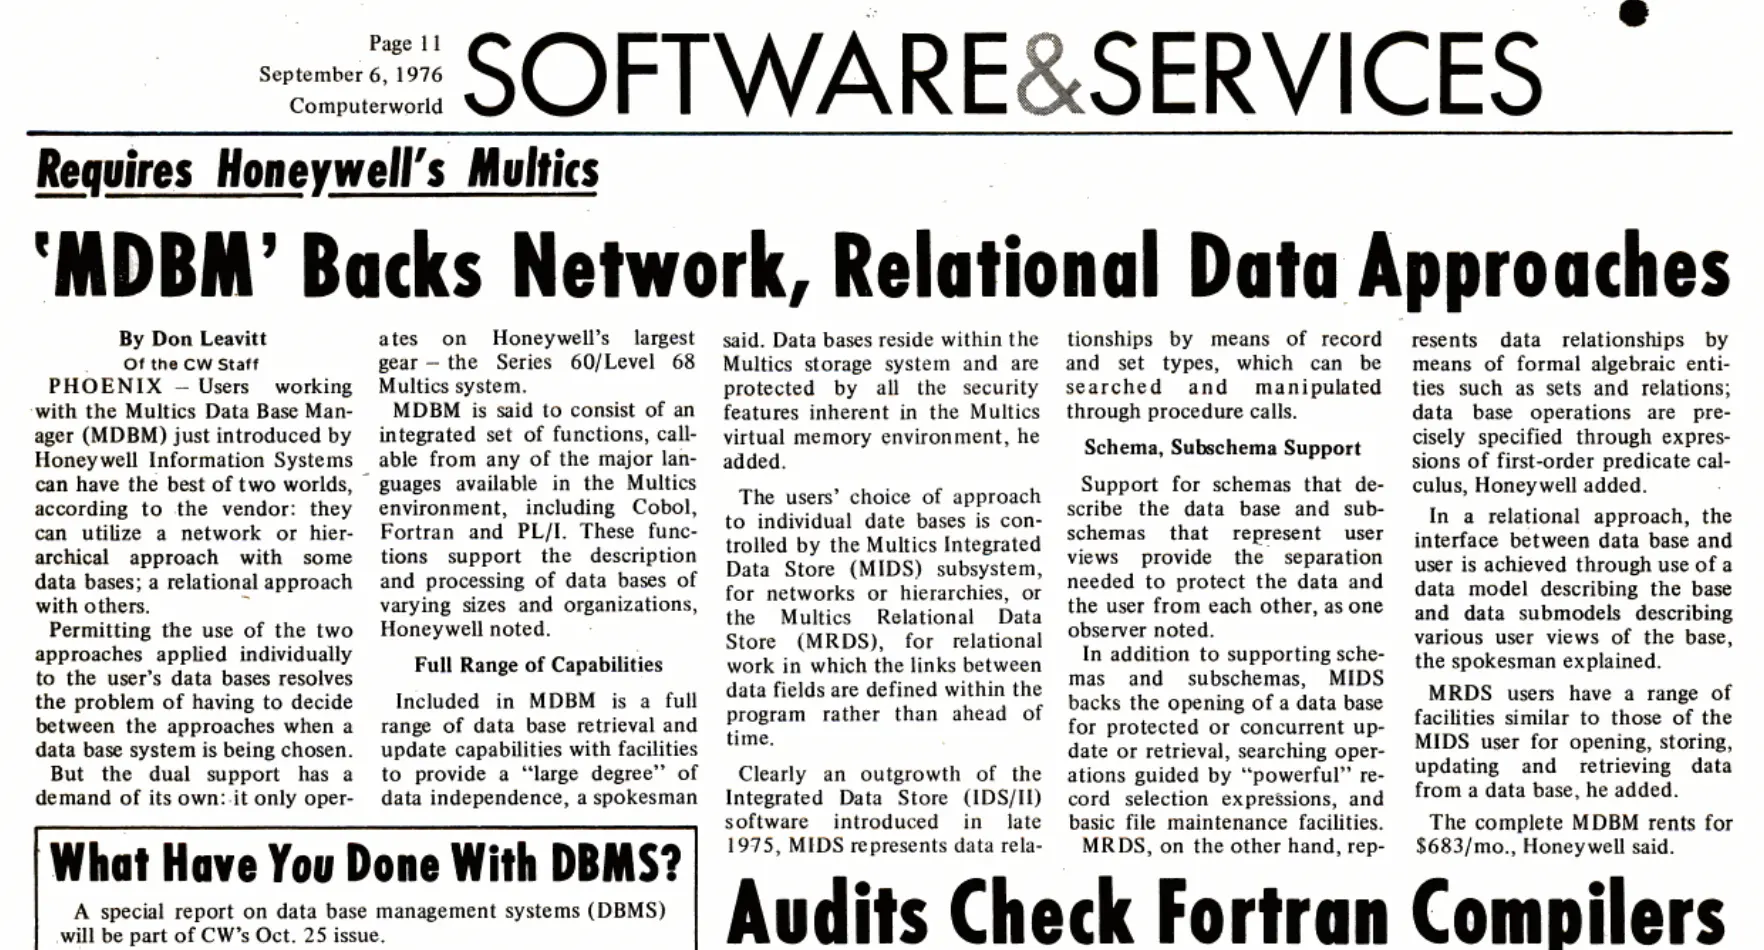
Computerworld coverage of Honeywell’s MRDS launch (September 1976) — part of Honeywell’s high-profile global rollout and among the first commercial ads for a relational DBMS. Source: Google Books
C41_MULTICS_MRDS
C42_ORACLE_HARDWARE
Honeywell’s MRDS showed that a major vendor could package relational software, but its adoption was tied to Multics hardware and never spread far. The constraint highlighted a bigger question: could databases break free from specialized systems and reach wider markets? Oracle’s answer was to make portability the core of its design.
C42_ORACLE_HARDWARE

From Room-Sized Mainframes to Desk-Fit Minicomputers
Oracle’s rise was built on portability. While IBM’s System R prototypes required expensive mainframes and internal resources, Oracle targeted smaller markets with a database that could run on minicomputers. Its first releases operated in just 128KB on Digital’s PDP-11 — a radical step toward affordable, portable relational systems.
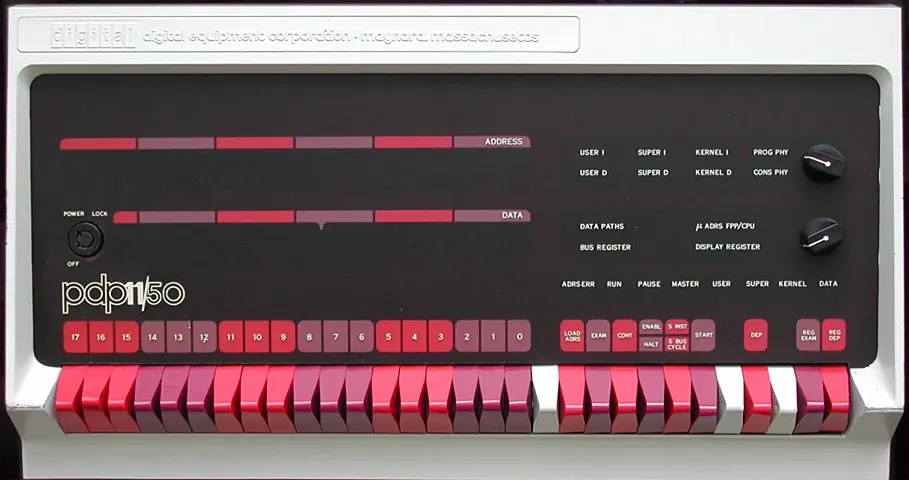
Control panel of the PDP-11 minicomputer, the platform for Oracle’s first relational database (c. 1976). Oracle’s engine ran in just 128KB on this compact hardware, contrasting with IBM’s mainframes. Photograph by Frank da Cruz. Source: Columbia University
A key milestone came with Oracle Version 3, when the system was rewritten in the C programming language. That decision, pushed internally by Bruce Scott, freed Oracle from hardware dependence and made it runnable across PDP systems, UNIX workstations, and eventually personal computers.
This emphasis on portability became Oracle’s competitive edge. At a time when most databases were tightly bound to specific machines, Oracle’s strategy favored reach over raw optimization, laying the groundwork for cross-platform dominance in the relational market.
C42_ORACLE_HARDWARE
Cluster C5
The commercial rollout of relational systems revealed the stakes of design choices. Honeywell tied MRDS to Multics, showing relational software could be offered as part of an established operating system, but its reach was narrow. Oracle built the opposite strategy, stripping dependence on specific machines and pushing portability as a market advantage.
Together, these approaches marked the transition from relational theory to competing business models. The next challenge was deeper: making these systems reliable, consistent, and usable at scale.
C5
Relational Software Ecosystem
By the 1980s, relational databases shifted from isolated projects into a wider software economy — a web of companies, languages, and platforms competing and cooperating at the same time. University research groups spun off firms like INGRES, while startups like Oracle expanded aggressively into commercial markets.
Relational systems also reshaped programming itself, linking SQL with C to create a durable bridge between high-level queries and low-level control. Out of these convergences came an ecosystem — not just products, but a platform for how data would be built, sold, and integrated across industries.
C51_INGRES_MARKET

INGRES — Berkeley’s Commercial Rush
INGRES stood apart from IBM’s System R and Oracle’s early products. Developed at UC Berkeley by Michael Stonebraker and his team, it served as both a research platform and a teaching tool, making relational databases accessible to students and researchers worldwide. Its open, experimental character contrasted with IBM’s tightly controlled prototypes and Oracle’s aggressive commercial push.
Commercials from magazines
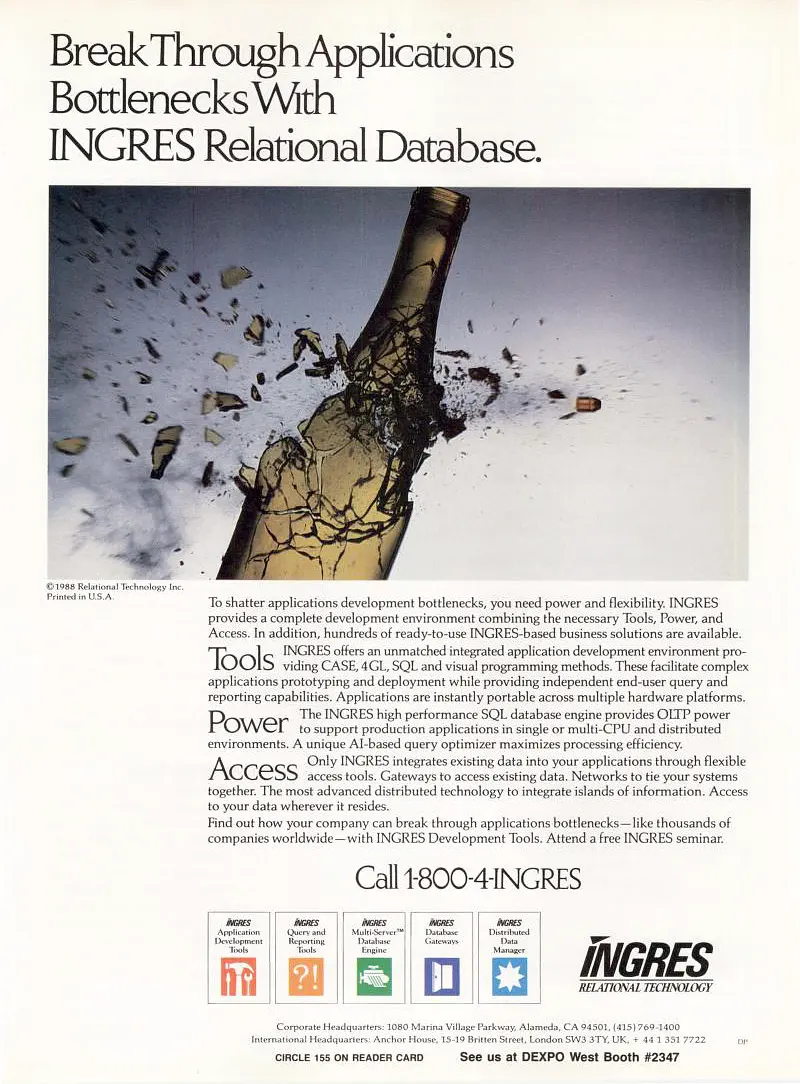
Advertisements for INGRES in computer trade magazines (early 1980s) — positioning the Berkeley spinoff as a challenger to IBM’s slower-moving offerings. Source: Archive.org
Advertisements for INGRES in computer trade magazines (early 1980s) — positioning the Berkeley spinoff as a challenger to IBM’s slower-moving offerings. Source: Archive.org
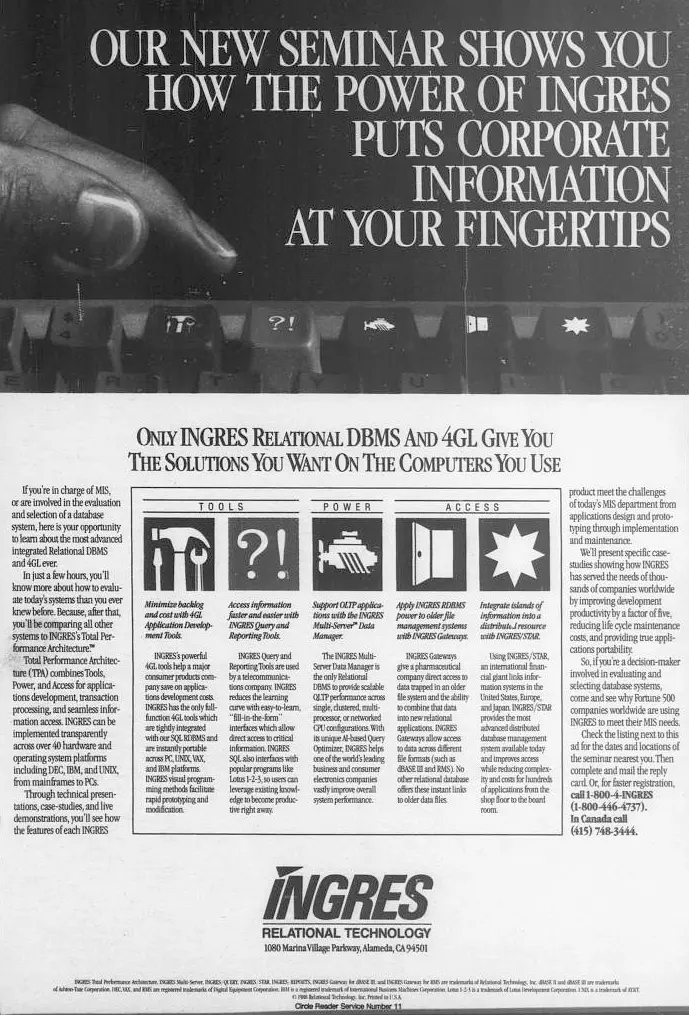
Advertisements for INGRES in computer trade magazines (early 1980s) — positioning the Berkeley spinoff as a challenger to IBM’s slower-moving offerings. Source: Archive.org
Humorous video advertisement of Ingres. 1980s
In 1980, the team launched Relational Technology Inc., one of the first startups devoted to database software. INGRES’s portability and academic credibility gave it traction in universities and midsize businesses, where it offered a credible alternative to proprietary systems. It showed that relational software could grow not only through corporate channels but also through academic networks that seeded talent, tools, and ideas across the industry.
C51_INGRES_MARKET
C52_C_SQL_CODEPENDENCE
While INGRES moved quickly from lab to market, IBM advanced more cautiously. System R proved the model inside controlled settings, but its commercialization lagged. That hesitation opened space for Oracle, INGRES, and others to shape the early relational marketplace. The contrast was sharp: one path guarded by corporate bureaucracy, the other propelled by entrepreneurial urgency.
C52_C_SQL_CODEPENDENCE

C, SQL, and the Ties That Bind
As relational databases spread into real-world use, they needed to fit into existing software ecosystems. That meant bridging SQL — a high-level, declarative query language — with the low-level power of system programming. In the 1970s and early 1980s, that meant C.
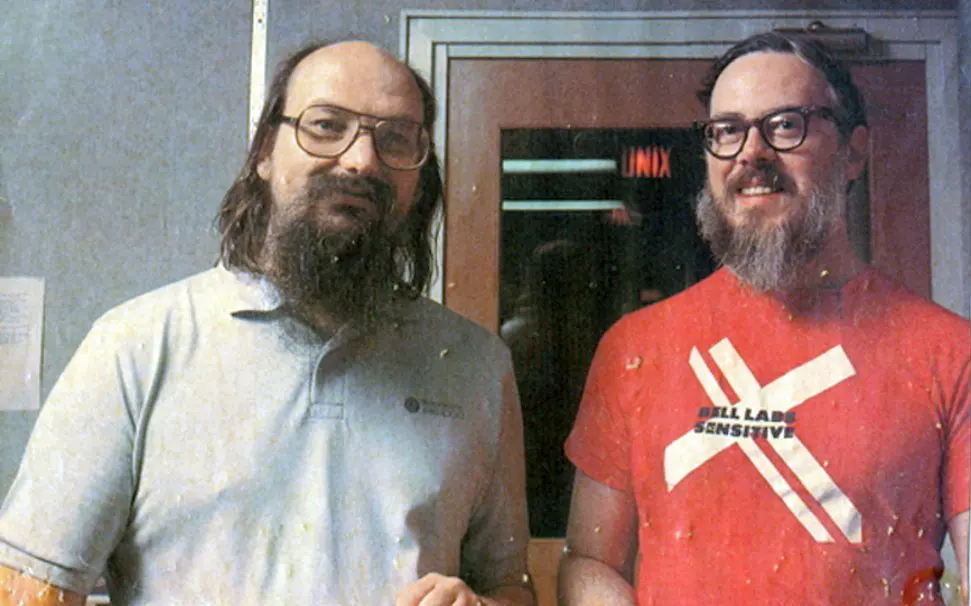
Ken Thompson and Dennis Ritchie at Bell Labs (1970s–1980s). Their creation of C provided the foundation for operating systems and database engines alike. Source: Computer History Museum
Originally developed at Bell Labs for UNIX, C became the language of choice for operating systems and high-performance applications. Its portability, memory control, and ability to interface directly with hardware made it ideal for embedding database engines like Oracle and INGRES. Oracle’s shift from assembly to C allowed the database to scale across platforms, from PDP-11s to minicomputers and eventually PCs.
Developers also needed ways to issue SQL queries from within C programs, leading to embedded SQL, APIs, and eventually standards like ODBC. This coupling between SQL and C defined a generation of software design, intertwining business logic with database access at the code level.
C52_C_SQL_CODEPENDENCE
Cluster C6
The relational boom was sustained by the mechanics that governed how data was linked and how users touched it. Keys gave tables their grammar; terminals gave SQL its first stage.
C6
Foundations of Relational Interaction
Relational databases became real through working habits. Two elements anchored this: the grammar of keys that linked tables together, and the interfaces where users typed commands. These foundations defined both how data was structured and how people could reach it.
C61_RELATION_KEYS

Keys and Relations — The Grammar of Structure
The power of the relational model lay in how it connected data. Each row in a table carried a “primary key” — a customer ID, invoice number, or another unique marker. “Foreign keys” pointed from one table to another’s primary key, weaving relationships: an order tied to a customer, a payment linked to an invoice, a student mapped to a course.
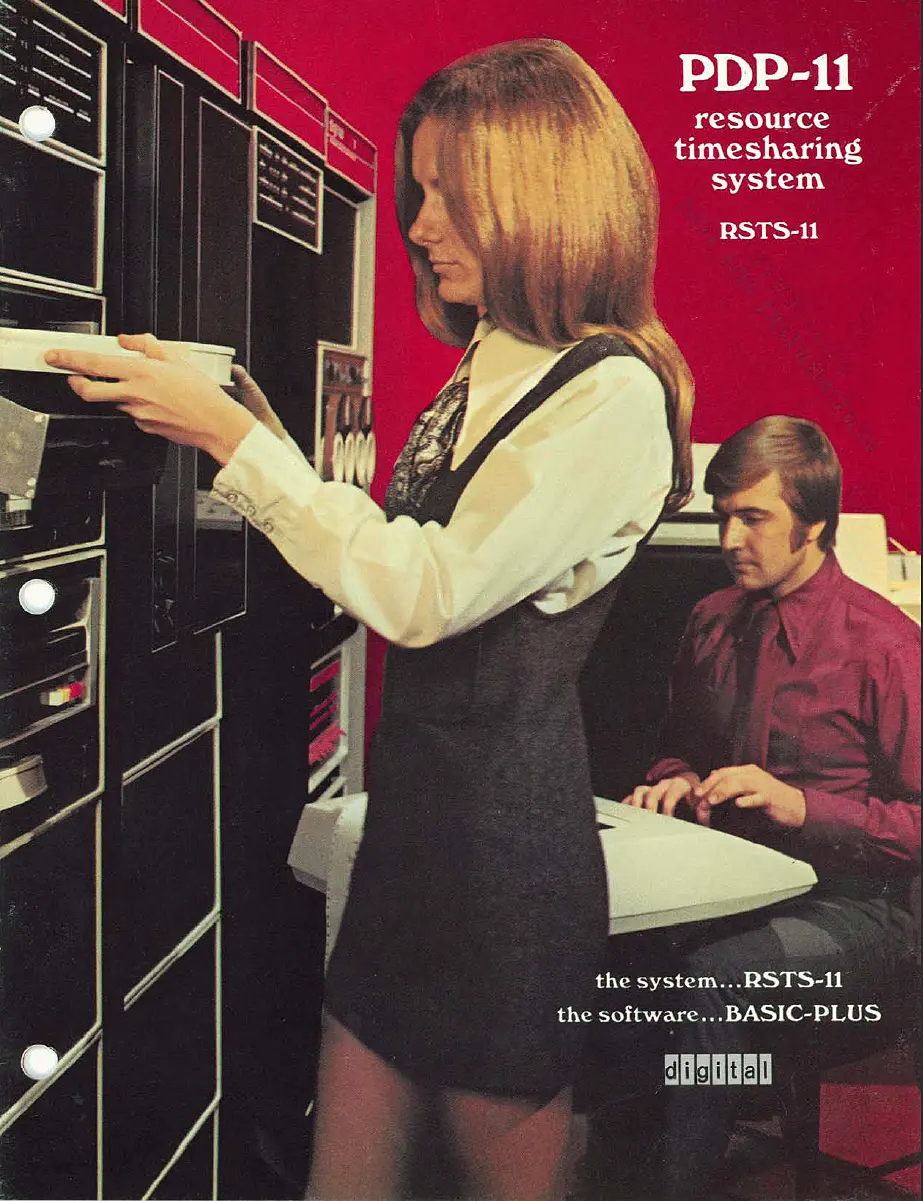
PDP-11 brochure cover (1970). Relational concepts such as keys were applied to data managed on systems of this era. Source: Computer History Museum
This grammar of keys enabled normalization — reducing duplication and enforcing consistency across sprawling systems. Instead of repeating the same details in every record, databases stored them once and referenced them wherever needed. Codd’s abstract theory of relations thus became a practical framework for structuring business processes, research datasets, and institutional records.
C61_RELATION_KEYS
Supercluster D
Relational design ended the era of ad hoc data handling. Its rules gave databases a consistent structure, where relationships could be declared and enforced across whole systems.
This shift elevated databases from tools of calculation to platforms of organization. By embedding logic directly into storage and links, they created a foundation resilient enough to support modern software ecosystems and entire data-driven industries.
The Object-Oriented Model — Languages, Databases, and Interfaces
The relational model had given data independence and structure, but it also revealed new limits. Tables worked for transactions and records, yet struggled with systems that involved feedback, hierarchy, or behavior. As computing expanded into simulation, design, and interactive graphics, the problem was no longer how to separate data from code, but how to bring them together.
This was the ground for the object-oriented model that framed data as behavior like the relational model had framed it as algebra. This turned programming into an environment of actors, blurred the lines between storage and logic, and redefined how people worked with digital systems.
D1
Modeling the World: The Rise of Object Orientation
D10_SIMULA_OOP

Simula and the Invention of OOP
Computer studies in Norway began in the 1950s within military research. Physicist Jan V. Garwick introduced digital methods at the national Defense Research Establishment, where Ole-Johan Dahl and Kristen Nygaard later collaborated on modeling complex systems such as bank queues and shared resources.
Collaboration with Manchester delivered Norway’s first Mercury computer in 1957, and by the early 1960s the Norwegian Computing Center in Oslo became a hub for their work.
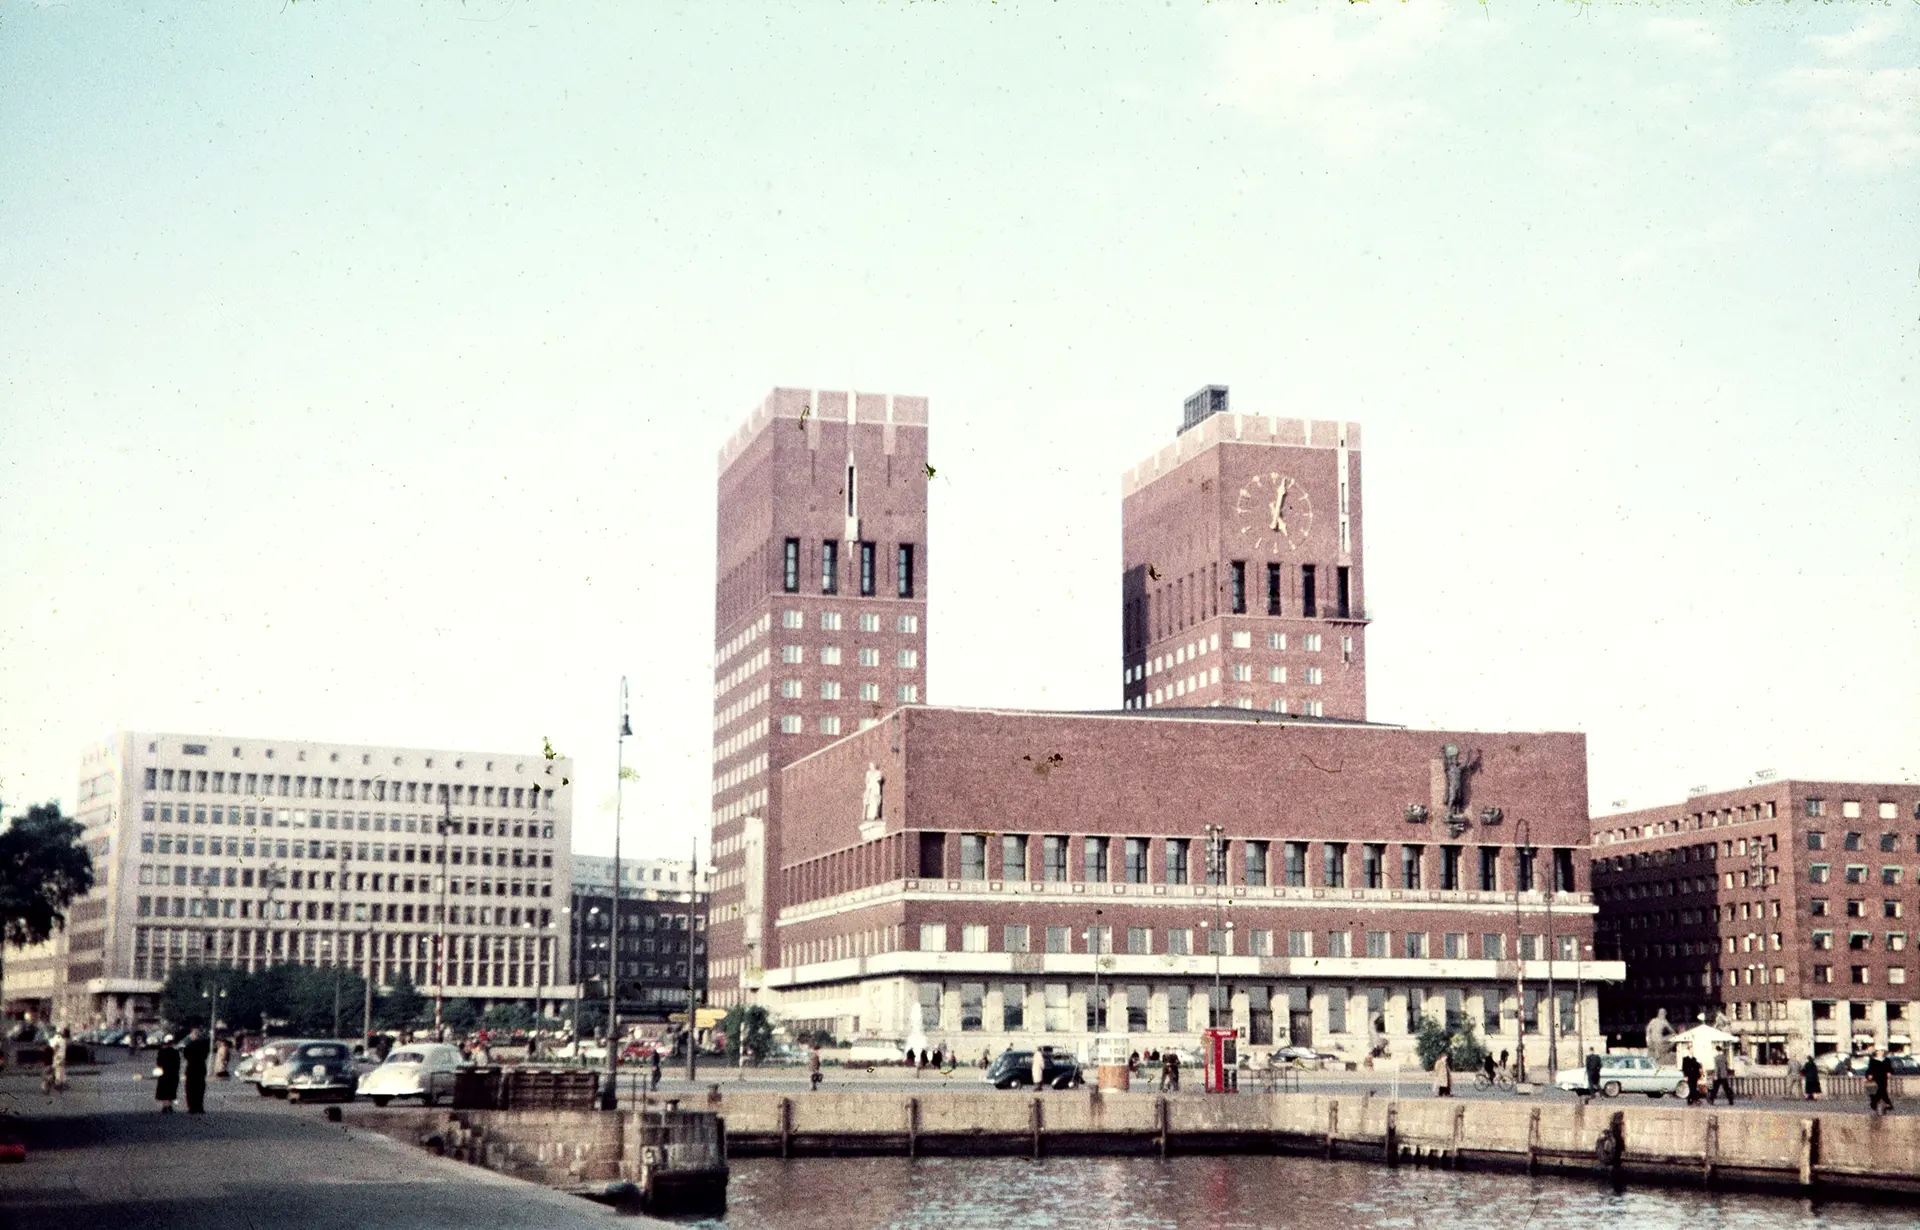
Oslo Town Hall (1956). Ole-Johan Dahl first attended NDRE computing sessions here, where Norway’s defense establishment introduced digital methods to researchers. Source: DigitaltMuseum
Their language, Simula I (1965) and its successor Simula 67, introduced the concept of objects: program units with identity, data, and behavior. Conceived as tools for simulation, they established principles that would shape later programming.
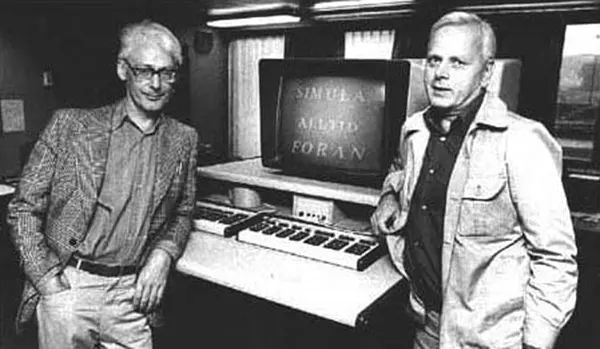
Ole-Johan Dahl and Kristen Nygaard. Their collaboration at the Norwegian Computing Center produced Simula I and Simula 67, the first object-oriented languages. Source: History-Computer
Computer scientist Georg Philippot, recalling his time teaching Simula on a CDC 3300, described ending a course with a program that played Chopin’s funeral march as the machine was retired — a symbolic farewell to early computation and the beginning of a new paradigm.
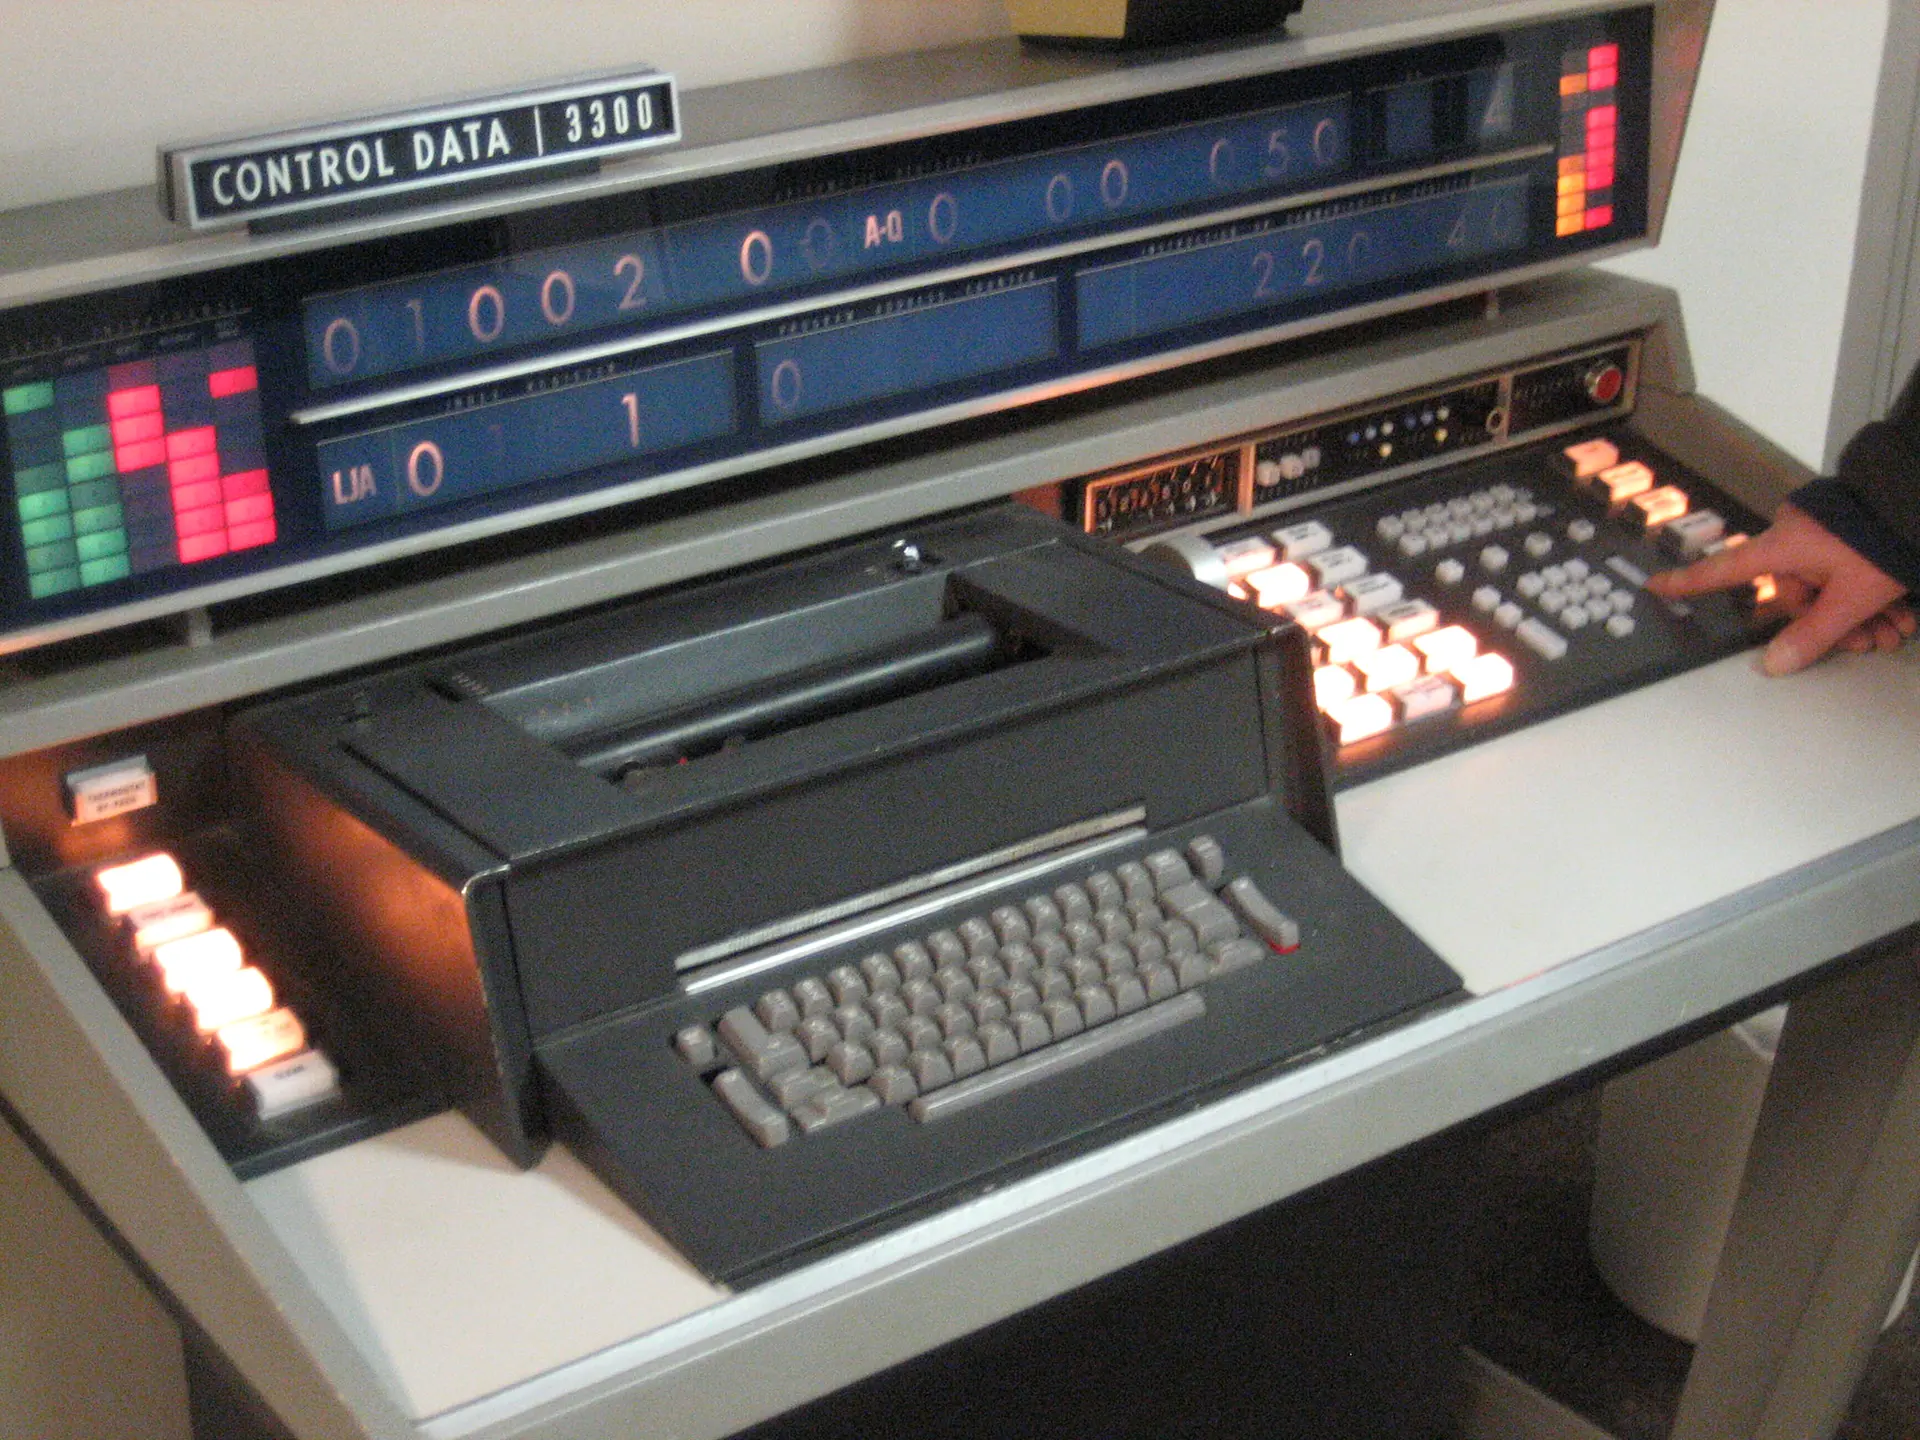
CDC 3300 terminal at the computing center in Berlin. Machines like this hosted Simula courses. Source
D10_SIMULA_OOP
D11_OOP_DEFINITION
Simula showed that programs could be built from objects rather than procedures, but its reach was limited. The larger question was how to describe this new style in general terms — not as a simulation language, but as a model for structuring software itself.
D11_OOP_DEFINITION
What Is Object-Oriented Programming?
Object-oriented programming (OOP) structures software around objects — units that combine data (attributes) with behavior (methods). Each object belongs to a class, which defines its properties and capabilities.
Classes can inherit traits from other classes, allowing shared logic while supporting specialization. A “Vehicle” class, for example, can define rules common to all transport, while “Car” and “Bike” extend it with their own features.

The Simula logo, created in Oslo during the 1960s. Simula introduced the concept of objects and became the first object-oriented programming language. Source
Objects interact by sending messages that invoke behavior, making systems evolve through encapsulation and modular design. Originally built for simulation, OOP soon became a general programming paradigm. It underpins most modern software design, from operating systems and business platforms to mobile apps and video games.
D11_OOP_DEFINITION
D13_SMALLTALK_JAVA
Defining objects as units of data and behavior reframed software as a network of agents that exchanged messages and reacted to events. Programs no longer ran as linear scripts but as interactions among components.
This shift made it possible to build systems from modular pieces, adapt them without rewriting everything, and mirror real-world hierarchies more closely than procedural logic allowed. The next step was to embed these principles in languages and environments designed entirely around them.
D13_SMALLTALK_JAVA
Smalltalk to Java — Language Evolution
At Xerox PARC in the early 1970s, Alan Kay and his team drew on Simula, Sketchpad, and LISP to design Smalltalk — a system where everything was an object, from numbers to windows. It introduced dynamic class creation, inheritance, and a live graphical interface, offering an integrated environment rather than a standalone language.
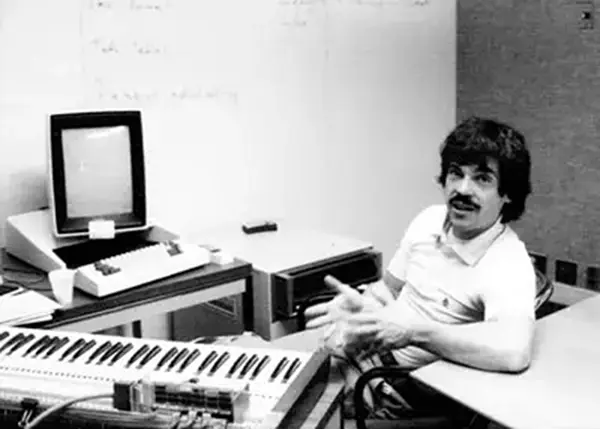
Alan Kay at PARC. His background in music shaped his vision of software as modular, interactive, and improvisational — ideas that guided the creation of Smalltalk in the 1970s. Source: CyborgAnthropology
Cover of Smalltalk-80: The Language (1989) by Adele Goldberg. As part of the Xerox PARC team, she co-developed Smalltalk and advanced key object-oriented concepts that later influenced mainstream programming. Source: Amazon
While commercially limited, Smalltalk’s ideas shaped the next generation of programming. In the 1980s, C++ extended the C language with classes, bringing object orientation into mainstream engineering. By the 1990s, Java simplified object-based design for the web era, and Microsoft’s C# followed with a hybrid model for enterprise software.
D13_SMALLTALK_JAVA
D14_OBJECTS_RUNTIME
Smalltalk had shown what a world built entirely from objects could look like, but it was C++ and Java that carried the model into everyday practice. By the 1990s, object orientation was the default framework for building software. Code was no longer a static plan but a dynamic environment of actors in motion.
D14_OBJECTS_RUNTIME

Objects in Motion — Simulation and Runtime
Object orientation reshaped runtime environments by modeling programs as systems of interacting entities. Instead of treating code as a single flow of instructions, it allowed multiple objects to act in parallel, each maintaining its own state and responding to events.
This approach, first explored in Simula’s simulations and then applied to visual interfaces, soon shaped interactive software more broadly. Early computer games became laboratories for object-oriented thinking, where complex behavior emerged from collections of autonomous agents rather than centralized scripts.
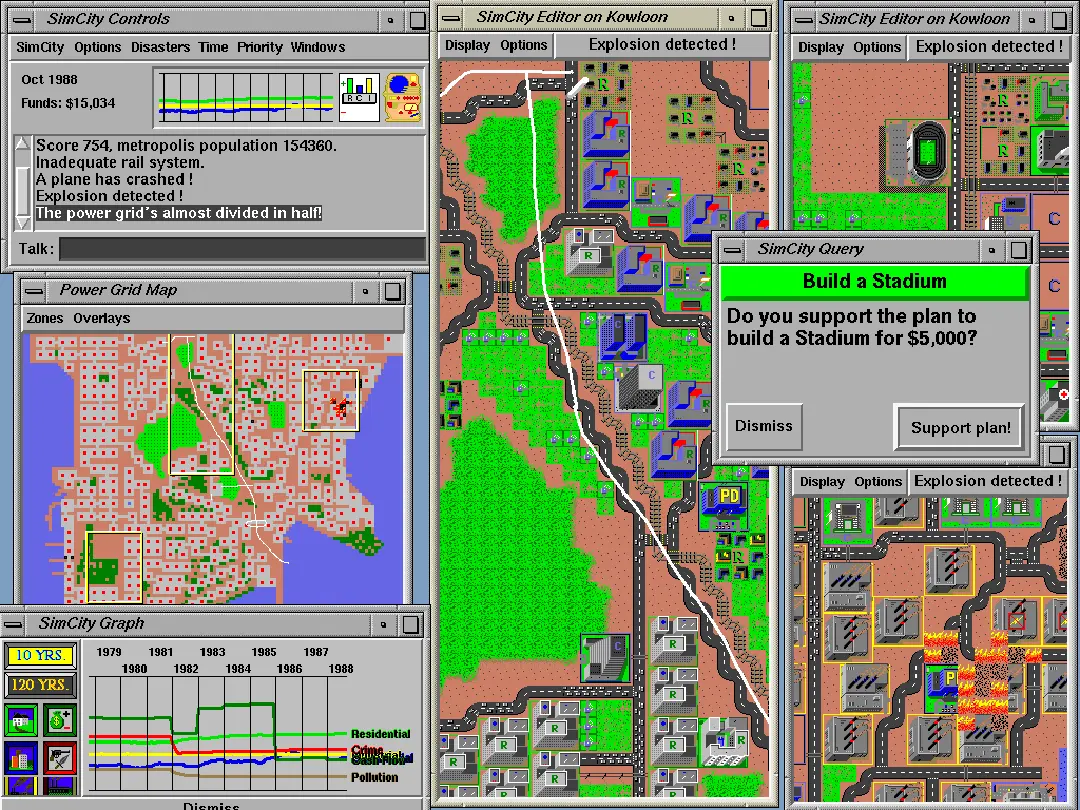
SimCity (1989). Buildings and services function as autonomous objects, with the city emerging from their interaction and responses to changing conditions. Source
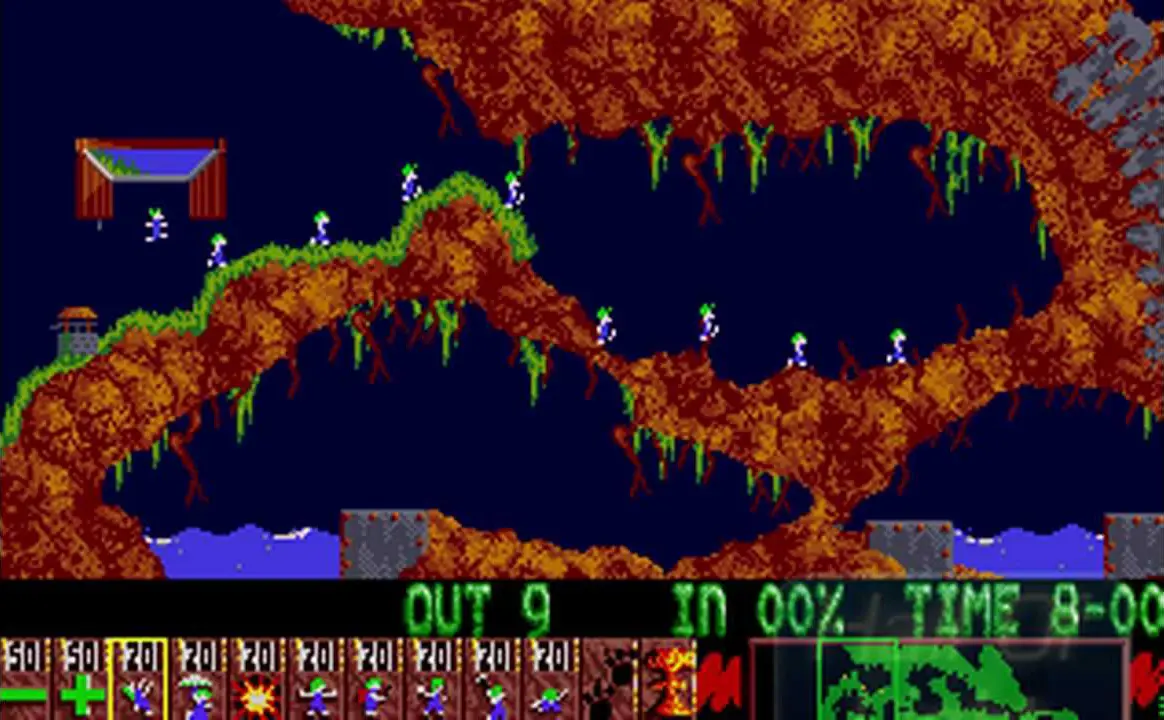
Lemmings (1991). Each lemming follows its own rules. Gameplay comes from coordinating a swarm of reactive objects through a shifting environment. Source
Little Computer People (1985). A simulated household built from objects. Behavior arises not from direct scripts but from the state and affordances of items in the environment. Source
D14_OBJECTS_RUNTIME
Cluster D2
As programs grew into systems of interacting objects, software became more flexible. But that brought another challenge: persistence. Relational tables could hold values, yet they split apart the structures that defined objects in memory. Extending the object model into data storage became the next frontier.
D2
Object-Oriented Data Systems — Promise and Limits
By the mid-1980s, the object model had become an influential paradigm in programming, and attention turned to its use in data management. New domains demanded storage that could handle hierarchies, versions, and complex relationships.
D21_OODBMS_ARCHITECTURE

Building OODBMS — Architecture and Challenges
As applications grew more complex — in areas such as computer-aided design, multimedia, and geographic information systems — relational databases revealed their limits. Flat tables and joins could not easily handle nested structures, versioning, or user-defined behaviors.
The solution proposed in the mid-1980s was the object-oriented database management system (OODBMS). In these systems, data entries were full objects with identity, structure, and behavior, often linked in complex hierarchies. Methods as well as attributes could persist, narrowing the gap between code and storage.
Early projects such as GemStone (built on Smalltalk) and Orion (written in Common Lisp) attempted this fusion of programming environments with persistent storage. They illustrated both the appeal and the difficulty of merging two paradigms that had evolved separately.
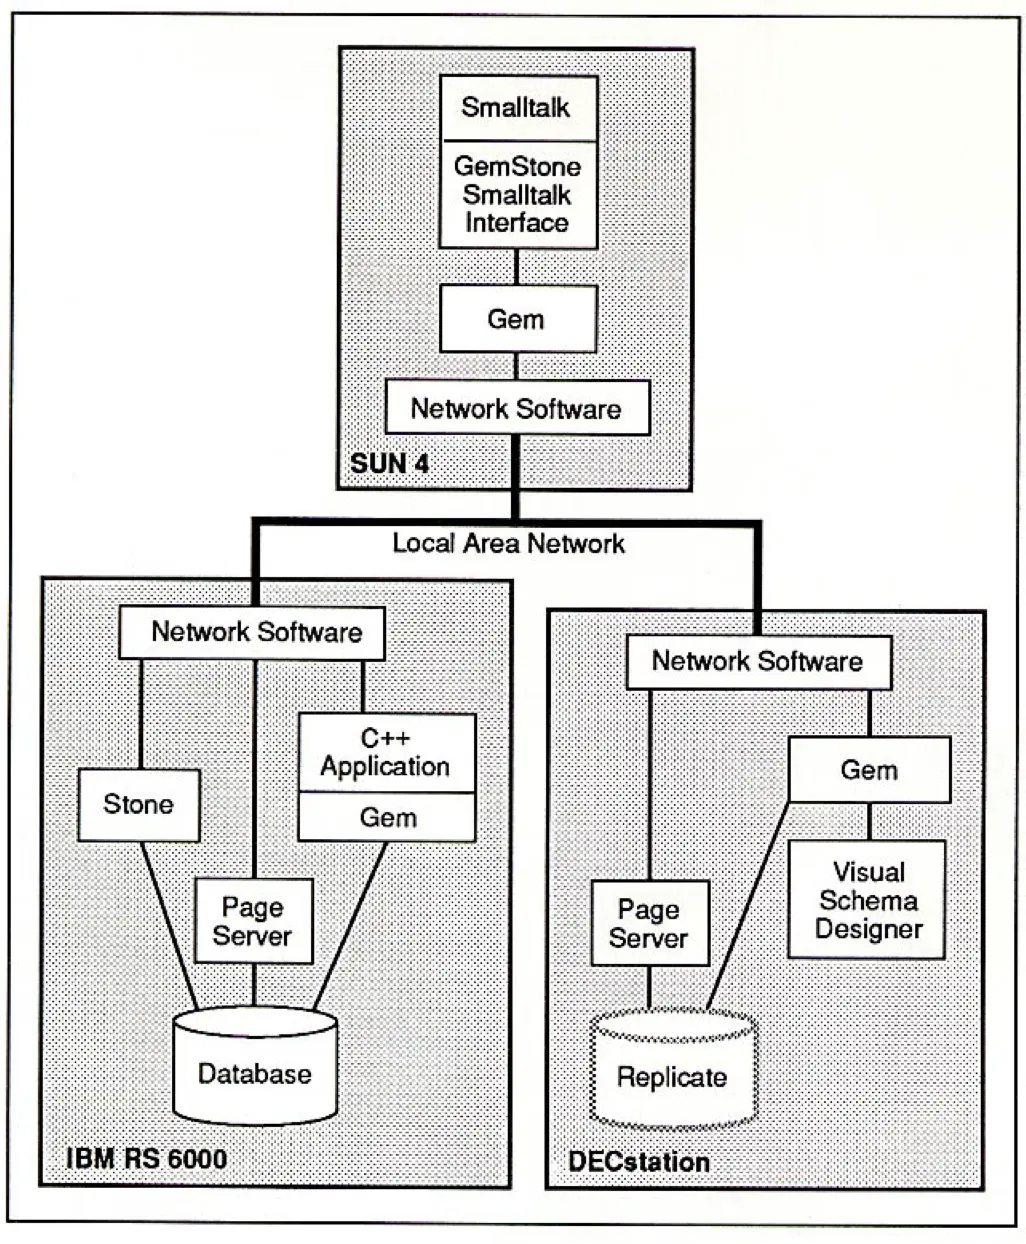
Interface from GemStone/S 2.5. This object-oriented database merged Smalltalk’s class structures with persistent storage, demonstrating how OOP principles were applied to data management. Source: The GemStone Object Database Management System, p. 68
D21_OODBMS_ARCHITECTURE
D23_OODBMS_FAILURE_HERITAGE
The very features that made OODBMS powerful — merging code with data and supporting intricate hierarchies — introduced issues of standardization, schema evolution, and tooling. These difficulties ultimately kept the model from achieving broad commercial success.
D23_OODBMS_FAILURE_HERITAGE

From Promise to Postmortem — The Rise and Fall of OODBMS
Object-oriented databases promised to eliminate the “impedance mismatch” between code and storage. By treating data entries as objects, they seemed to offer a natural fit for CAD, multimedia, and simulation systems that demanded complex hierarchies and evolving relationships.
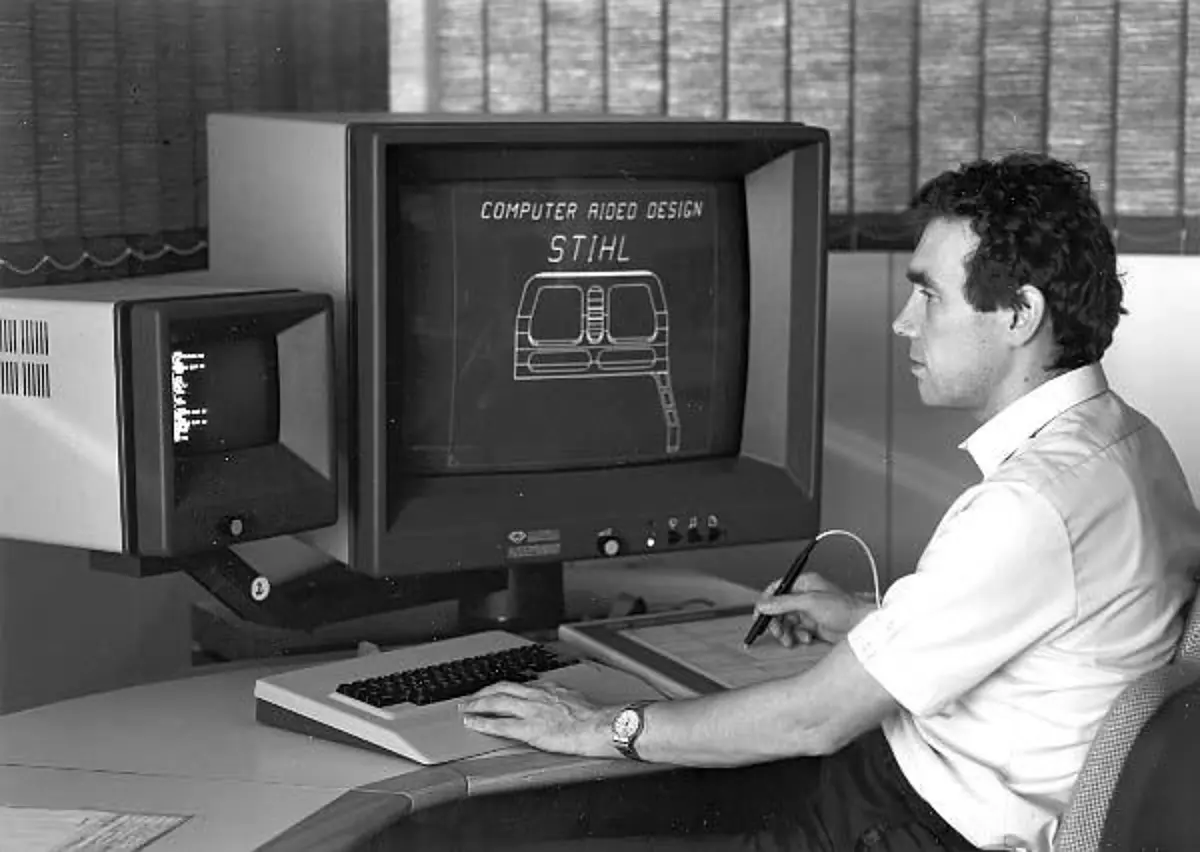
CAD design of a Stihl chainsaw (1980s). Applications like CAD demanded hierarchies and versioning that relational systems struggled to handle. Source: Finnish Forest Museum Lusto; Metsähallituksen collection.
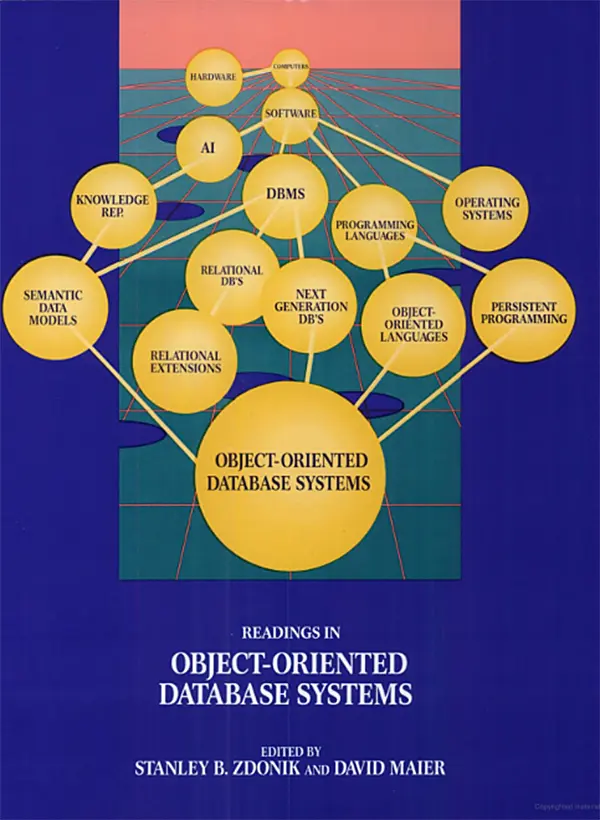
Readings in Object-Oriented Database Systems (1990), edited by Zdonik and Maier. This collection captured the momentum of OODBMS research — and the fragmentation that limited its adoption. Source: Google Books
Yet commercial adoption in the 1980s-90s faltered. Each platform tied objects to specific programming languages, and without a common query language like SQL, systems could not work well together. Schema changes were fragile, administrative tools were underdeveloped, and relational vendors kept improving performance and reliability, widening the gap.
Though most OODBMS products faded, their ideas persisted. Object-relational mapping frameworks like Hibernate and ActiveRecord reintroduced the concept at the application layer, while NoSQL systems such as MongoDB revived nested structures and flexible schemas. Even modern SQL engines now support complex types and JSON, echoing features pioneered by OODBMS.
Processing Now — The Stack We Stand On
Object orientation showed how far the pursuit of processing could go. It brought behavior into the heart of code, treating programs as systems of interacting agents. Extending that model into databases promised unification, but the failures of object-oriented storage revealed the limits of this ambition.
***
From the earliest procedures and rituals to relational logic and finally to objects, the history of processing traced a search for structures that could master complexity. Each generation carried the field further, until the very distinction between data and behavior became the horizon of what processing could achieve.
Representation is the act of making the world legible. Long before computers, people turned experience into symbols: marks on tablets, names in lists, columns in tables, lines on a map. These forms did more than record reality — they defined what could be seen, compared, and acted upon.
To represent data is to choose abstractions. A census transforms individuals into a population. A statistical table translates moral or social conditions into columns and rows giving insights. A graph reveals relationships hidden in numbers, while a diagram suggests how forces or flows behave. Each format carries its own assumptions, politics, and blind spots.
From counting and categorizing to state statistics, symbolic input for machines, and visual cultures of science, finance, and geography, representation has always shaped how societies decide what counts as knowledge.
The Pre-History of Programmable Hardware
A32_TABLES_GRAPHICS
Tabular Thought — From Gospels to Graphs
Eusebian canon tables from the Gospels, Armenian manuscript (12th century CE). A Christian adaptation of Hellenistic cross-referencing, these tables represent an early method for structuring complex information. Walters Manuscript W.538, fol. 10v. Source: The Walters Art Museum
Medieval Islamic scholars refined astronomical and mathematical tables, using them to convey empirical and calculated data. In Western Europe, tables were employed for liturgical purposes such as computing the Easter date, exemplified by Dionysius Exiguus's calendrical system in 532 CE.
By the 17th century, printed tables circulated widely, covering subjects from demographic counts to planetary motion, and provided a standardized format for organizing and comparing information.
A32_TABLES_GRAPHICS
Cluster A2
Tables did more than arrange information. They taught readers to compare, scan, and extract patterns. Once the form spread beyond scripture and scholarship, it became a common language for states, merchants, and scientists.
A2
Rationalizing the World: Data, Design, and the Logic of Representation
Once tables and lists could be scaled up, they became tools for designing order itself. Numbers did not just describe — they prescribed. Populations and resources were translated into regular grids, giving rulers and reformers the sense that society could be grasped, measured, and shaped. Representation here was not only about recording the world, but about imposing a logic upon it.
A22_ECON_GRAPHICS

Visualizing Economies — From Verbal Reasoning to Graphical Models
Throughout the 19th century, the integration of mathematical methods into economics began to reshape data interpretation, despite resistance from traditional theorists. Many early modelers — including engineers like Charles Ellet and Jules Dupuit — introduced diagrams and curves to represent trade, cost, and flow.
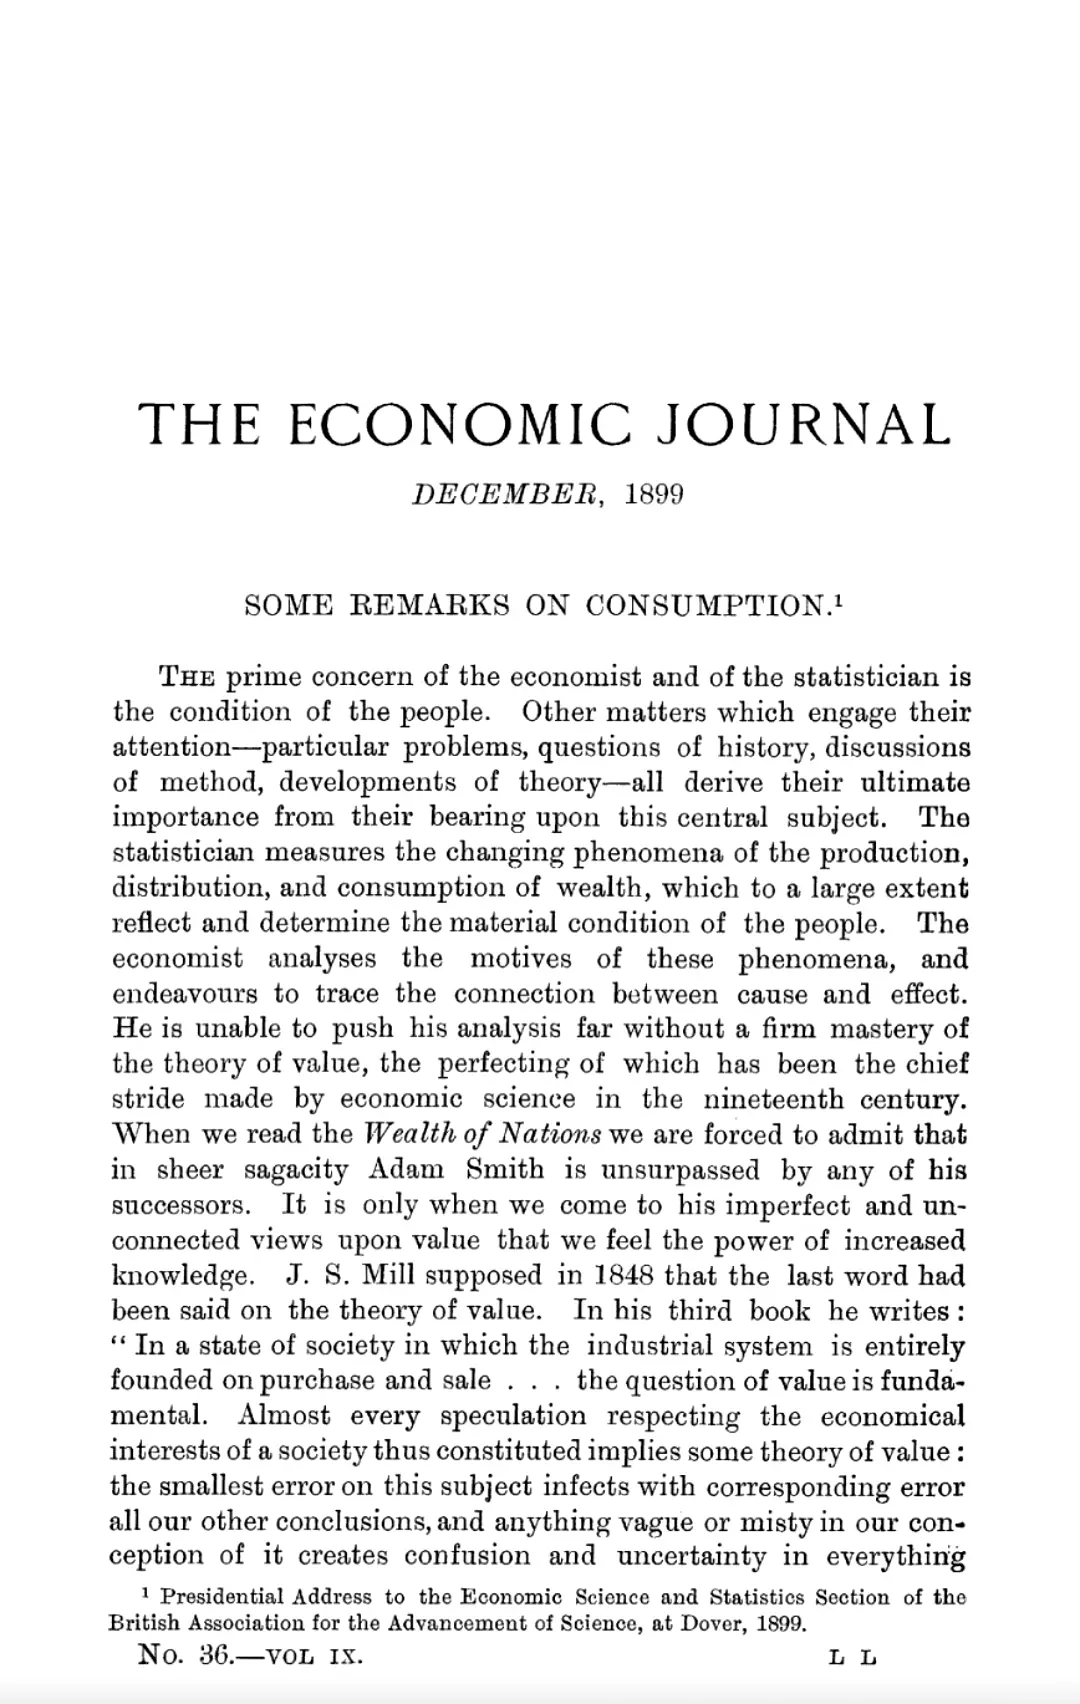
Henry Higgs, “Some Remarks on Consumption,” in the Economic Journal (December 1899). Illustrates how qualitative analysis and verbal reasoning still dominated economic theory at the turn of the century, while mathematical modeling remained rare. JSTOR
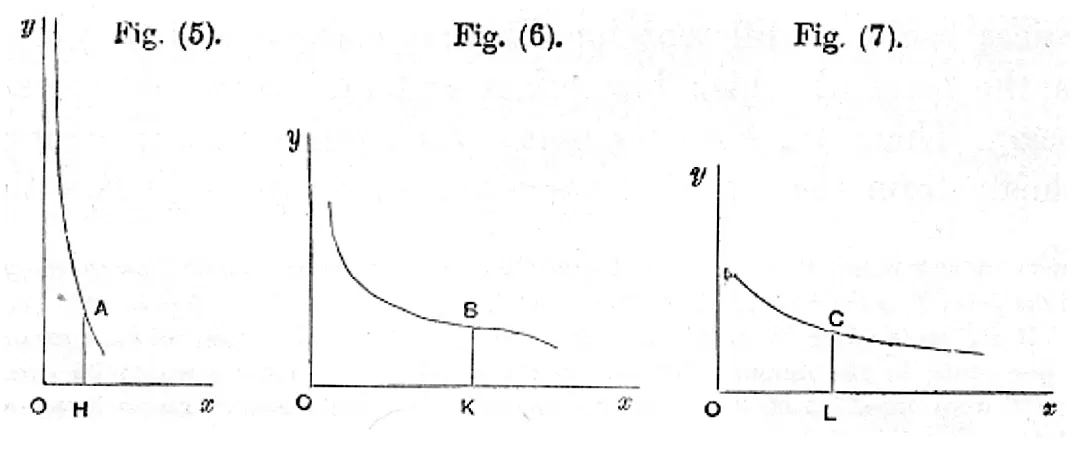
Alfred Marshall’s graphical models (1870s–1890s), p. 67. Early use of curves to represent economic forces such as supply and demand, helping to formalize economics as a mathematical science. EE-T Portal
Their attempts to visualize economic behavior were seen as marginal at first. As late as 1892, 95% of articles in the top four economics journals used neither mathematical notation nor graphs (Stigler and Friedland, The Journals of Economics).
Still, this shift was underway. By the 1870s, Alfred Marshall brought graphical modeling into the mainstream, using intersecting curves to depict market mechanisms. These visualizations made abstract theory accessible and policy-relevant — a foundational turn toward data-driven economic reasoning.
A22_ECON_GRAPHICS
A23_JACQUARD_PROGRAMMING
Curves and diagrams showed that abstract forces could be drawn, compared, and reasoned with. In the 19th century, another transformation unfolded: patterns and instructions could be transposed into grids and transferred to machines. What began as visualization in economics became, in textiles, a method of encoding and delegating design — a step from seeing the world differently to programming it.
A23_JACQUARD_PROGRAMMING

From Rule-Paper to Punch — Designing with Cards Before Computers
The Jacquard loom created a radically new workflow of design abstraction. The key step was the mise en carte: transposing a textile pattern into an enlarged grid (rule-paper), where each square represented a thread action. From this intermediate visualization, specialized workers could generate punched cards — the program — detached from the weaver and readable by the machine.
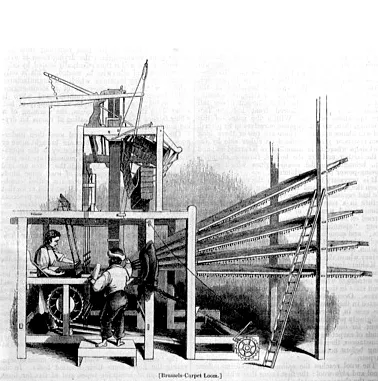
Jacquard engine attached to a carpet loom (c. 1840). From Toshio Kasamitsu’s doctoral dissertation, 1982, p. 52. Source
In 1835, French machine maker C. Guillotte described this logic-to-fabric pipeline before a British committee. His testimony revealed an early encounter with the formalization of instructions. Design was now “read in,” parsed into discrete mechanical steps, and stored in physical memory.
This early modularization of creative labor—design, translation, encoding—foreshadowed modern digital interfaces and data visualization. Long before computers, workers were debugging logic patterns and offloading execution to automated systems, mediated through symbolic encodings on physical media.
A23_JACQUARD_PROGRAMMING
A24_INSTITUTIONAL_CARDS
Jacquard’s loom turned representation into a layered process. A pattern was first visualized on paper, then abstracted into symbolic instructions, then re-materialized in fabric. Each stage separated design from execution, and each relied on a different medium to stand in for the idea. This modular chain of representation — paper, card, machine, textile — marked a turning point: instructions themselves could circulate as independent objects.
In the 1890s, Herman Hollerith adapted this same logic for the U.S. Census, proposing punched cards as a way to encode and tabulate population data.
A24_INSTITUTIONAL_CARDS
Tabulated Society — Punched Cards in Government and Business
After the success of the 1890 U.S. Census, punched card machines quickly became a pillar of state and corporate infrastructure. Already in 1891, governments in Canada, Norway, and Austria had adopted versions of punch-card tabulators for their own censuses.
Then, Hollerith’s systems — now under the Computing-Tabulating-Recording Company (CTR), which later became IBM — expanded from population counts to civil registries, tax records, military logistics, and industrial payroll.
Hollerith’s U.S. patents (Nos. 395,781–783, 1889), collectively describing his invention as the “Art of Compiling Statistics.” Google Patents
Herman Hollerith with his punch-card tabulating machine, used in the 1890 U.S. Census. Transcription required 72.5 hours (twice as fast as competitors), while tabulation took only 5.5 hours (ten times faster). MIT Technology Review
Scientific American, August 1890, featuring Hollerith’s census machine. From the collection of Dr. Sid Kolpas. Mathematical Association of America
In Europe, punched card tabulators were used to track unemployment during the Weimar Republic and later for darker purposes under totalitarian regimes. In the U.S., corporations adopted the technology to manage workers and inventories. Punched cards became tokens of identity: each card a fragile stand-in for a worker, a file, a life — processed at scale.
Their layout became standardized: 80 columns, rectangular holes, precise rows. What began as a statistical tool evolved into a universal format for encoding human activity. This expansion paved the way for mainframe computing, but it also quietly embedded new logics of sorting, surveillance, and abstraction — long before digital systems arrived.
A24_INSTITUTIONAL_CARDS
Cluster A3
Once adopted at scale, the punched card itself functioned as a medium of representation: each rectangle a proxy for a person, a wage, or a record. What seemed like a technical convenience quietly shaped how societies imagined identity and activity — as fields, codes, and slots that could be sorted and compared.
A3
Enumerating the World — Counting as Ritual, Power, and Abstraction
Counting has always been more than arithmetic. As enumeration expanded in scope, it hardened into formats that shaped how societies were seen: grids of households, forms of property, columns of births and deaths. Representation here was inseparable from classification — turning fluid realities into fixed slots.
A33_ENUMERATION

Enumeration and Meaning — From Lists to Categories
Enumeration isn't just about counting — it's about how categories get visualized and fixed. In the 17th and 18th centuries, European administrations relied on increasingly tabular formats: not simply ledgers of names and taxes, but forms that pre-structured reality into discrete fields, rows, and groupings.
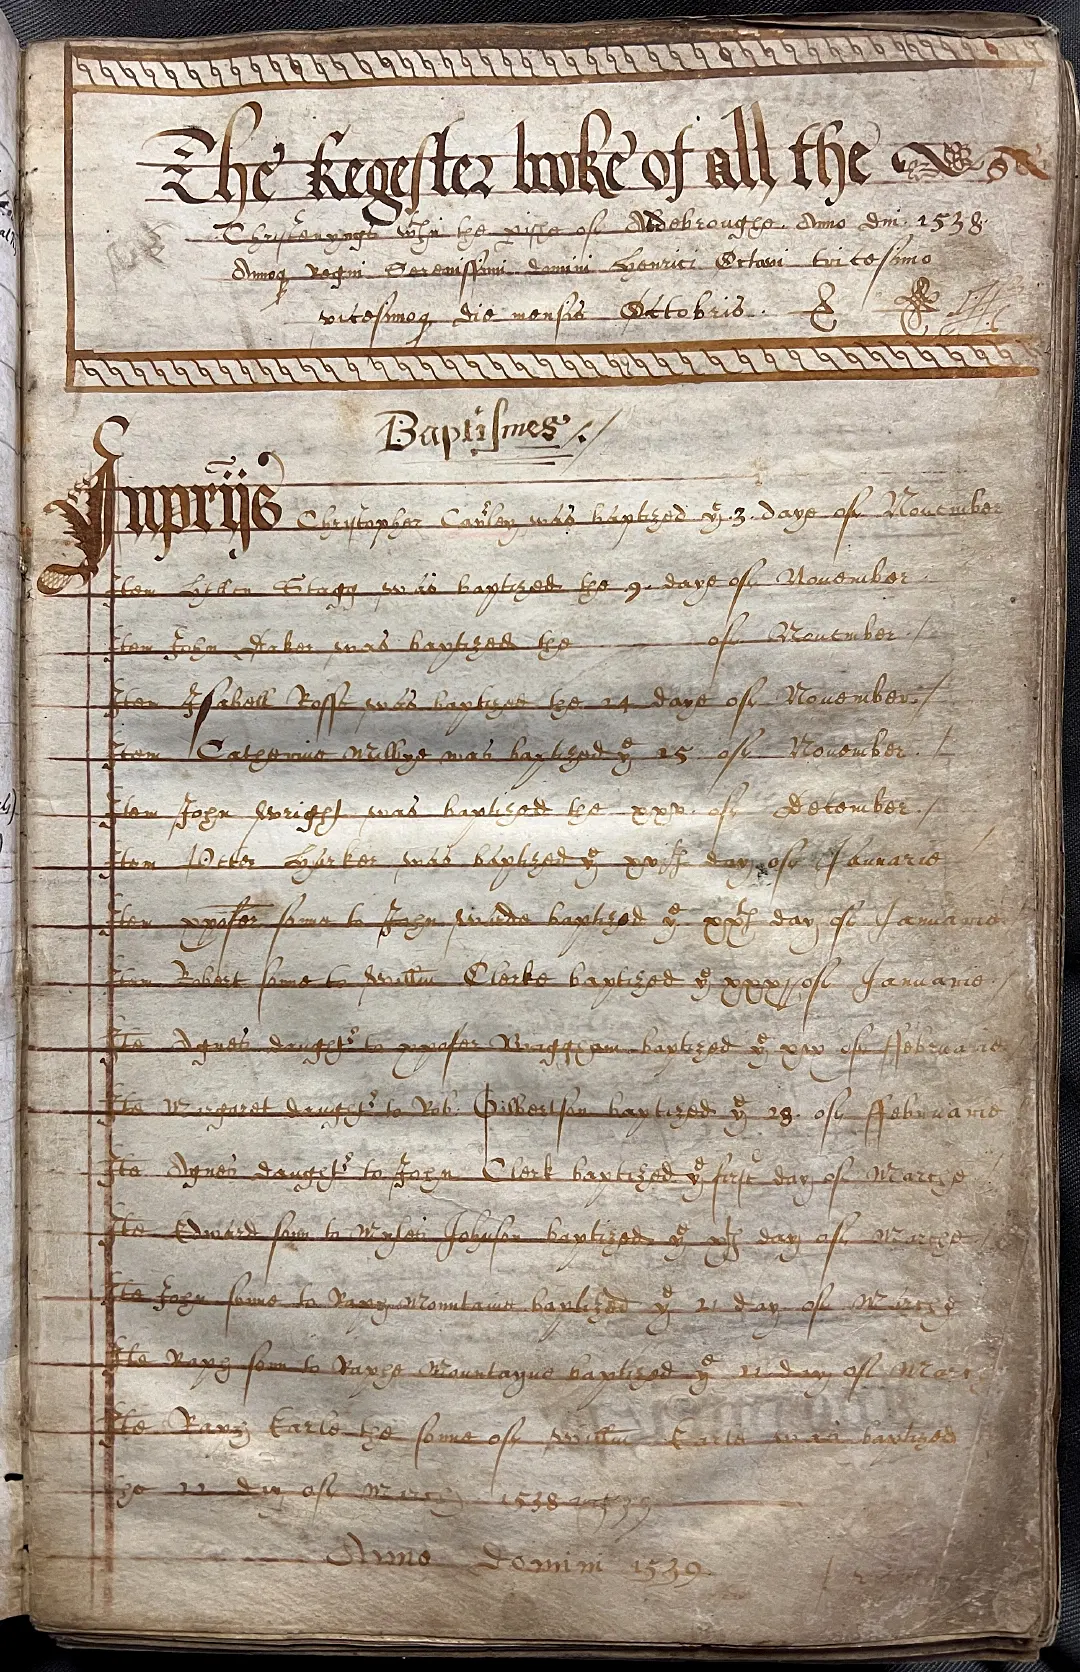
Parish register page (England, 17th–18th c.), with neatly ruled columns for baptisms, marriages, and burials. By reducing lived events to standardized entries, these registers transformed experience into categories. North Yorkshire Archive Blog
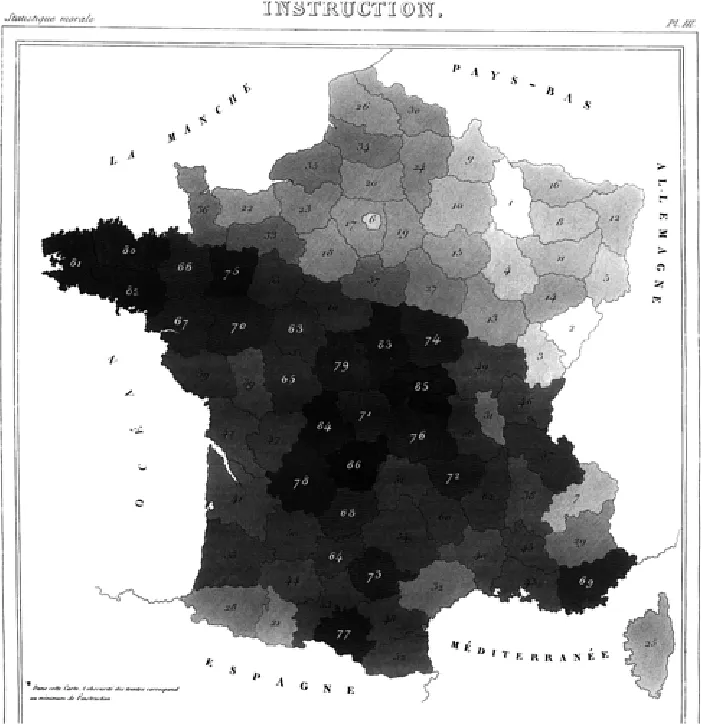
André-Michel Guerry’s “Instruction” map of France (1833), showing literacy rates by département with color shading. The map enforced classification and comparison within spatial and categorical constraints. ResearchGate
These documents forced complexity into grids. “Head of household,” “acreage owned,” “occupation,” or “tribe” became checkboxes. In colonies and empires, local identities were reshaped into legible categories that fit bureaucratic templates — erasing nuance in favor of scale and control.
This transition marked a foundational step toward modern data representation.
A32_TABLES_GRAPHICS
A34_ECON_ABSTRACTION
Tables did more than arrange information. They trained readers to think in grids. By forcing data into rows and columns, tables created a structure that made comparison, correlation, and projection possible. This was processing on paper — a format that compressed complexity into manageable sequences and prepared the ground for more abstract models. The next step pushed this logic further, as political arithmetic turned lists and tables into diagrams of entire economies.
A34_ECON_ABSTRACTION
From Political Arithmetic to Economic Diagrams — Data Selection and Abstraction
Mathematical methods pushed economic data beyond counts and inventories. But the abstraction came with choices: what to count, what to ignore, and how to draw a system where labor and material resistance disappeared.
This was no longer about describing society, but simulating it. Graphs of cost and output treated work as a function, not a force. The body vanished. Diagrams circulated through ministries and lecture halls, presenting a world of perfect inputs and optimized exchange.
Lancashire power loom from Richard Cotton Marsden’s “Weaving: Its Development, Principles, and Practice” (1895). English looms like this dramatically increased textile productivity while displacing skilled handweavers across the countryside. Source
Luddite resistance, engraving by unknown author (early 19th century). The uprisings of the 1810s were less a rejection of technology than a revolt against the erosion of skill, autonomy, and fair wages under early factory regimes. Smithsonian Magazine
In this shift, the loom returned — not as a machine, but as a metaphor. Economic modeling borrowed its logic: patterns encoded, complexity reduced, skill displaced. And just as mechanical looms once triggered uprisings among artisans, this new epistemic loom — operated by economists — restructured the world with invisible consequences.
A34_ECON_ABSTRACTION
A35_HYDRAULIC_ECONOMY
By the late 19th century, economists increasingly worked with diagrams, curves, and abstract models to represent flows of goods and behaviors of markets. These visualizations did not just display numbers but organized them into systems, turning production, cost, and exchange into patterns that could be manipulated and compared. Such models helped shift economic reasoning from descriptive accounts to formalized structures of analysis.
A35_HYDRAULIC_ECONOMY
Liquid Models — Simulating Economies with Analog Machines
While Herman Hollerith’s punch-card systems became the foundation of administrative computing, other thinkers explored more physical metaphors for modeling economic systems. In 1891, economist Irving Fisher built a hydraulic machine to simulate general equilibrium using interconnected tubes and flowing water. By adjusting valves and fluid levels, users could visualize supply, demand, and price dynamics across markets.
This idea didn’t end there. In 1949, Bill Phillips, a New Zealand economist and engineer, built the MONIAC — a larger hydraulic computer that modeled national income flows, taxes, investments, and savings using colored water in tanks and pipes. It became a teaching and policy tool, particularly in postwar Britain.
Irving Fisher’s hydraulic machine (1891). A pioneering attempt to simulate market equilibrium, using water to model flows of supply and demand. Conversable Economist
The MONIAC, built by Bill Phillips (1949). An analog computer using tanks and pumps to demonstrate Keynesian economics. Conversable Economist
These analog machines never reached administrative scale. But they represented an alternative path: computation through embodied simulation rather than abstraction. Their legacy is conceptual — a reminder that the urge to visualize systems long predated digital spreadsheets, and that data modeling once flowed, quite literally, through pipes.
A35_HYDRAULIC_ECONOMY
Cluster A4
Watching colored water circulate through tanks and pipes was calculation by analogy represented as performance. In these liquid models, the economy appeared less as numbers on a page than as a system coursing visibly before the eye.
A4
Business Data and Tabulation
As state and science refined their categories, business faced a parallel challenge: how to capture, display, and act on information at speed. Representation here took on a pragmatic edge. Numbers had to persuade investors, organize workforces, and reveal markets.
From scientific illustration to statistical graphics, the tools of visualization expanded into commerce, creating a shared language of charts, diagrams, and records.
A41_SCI_ILLUSTRATION

Image and Argument — Scientific Illustration as Data Practice
Before numerical models dominated, knowledge was often conveyed through images. Scientific illustrations meant more than decoration — they were essential tools for observation, measurement, and communication. In the Renaissance, artists like Brunelleschi and Piero della Francesca systematized linear perspective, providing a new framework for visual reasoning.
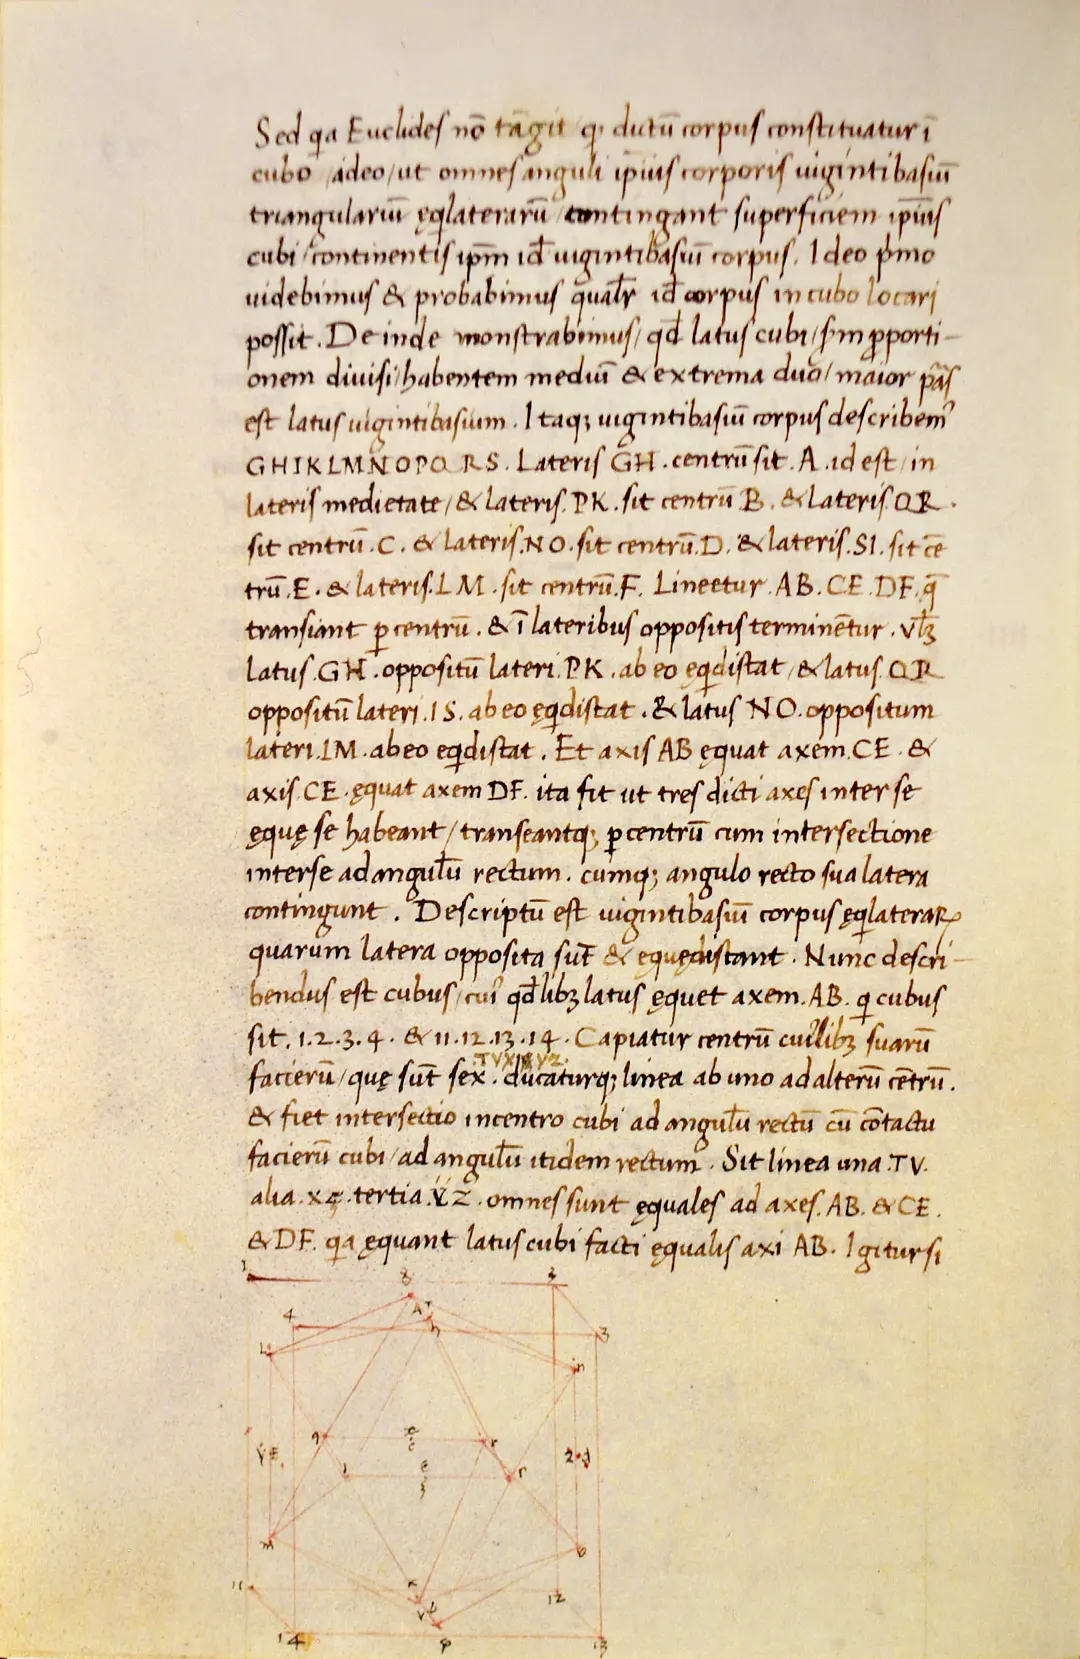
Geometrical drawing of an icosahedron inside a cube by Piero della Francesca, from “De quinque corporibus regularibus” (c. 1460). This study shaped post-Medieval fine arts and influenced the early development of data visualization techniques. Source
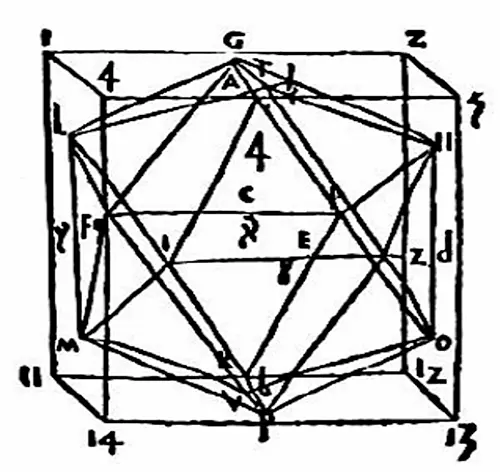
Geometrical drawing of an icosahedron inside a cube by Piero della Francesca, from “De quinque corporibus regularibus” (c. 1460). This study shaped post-Medieval fine arts and influenced the early development of data visualization techniques. Source
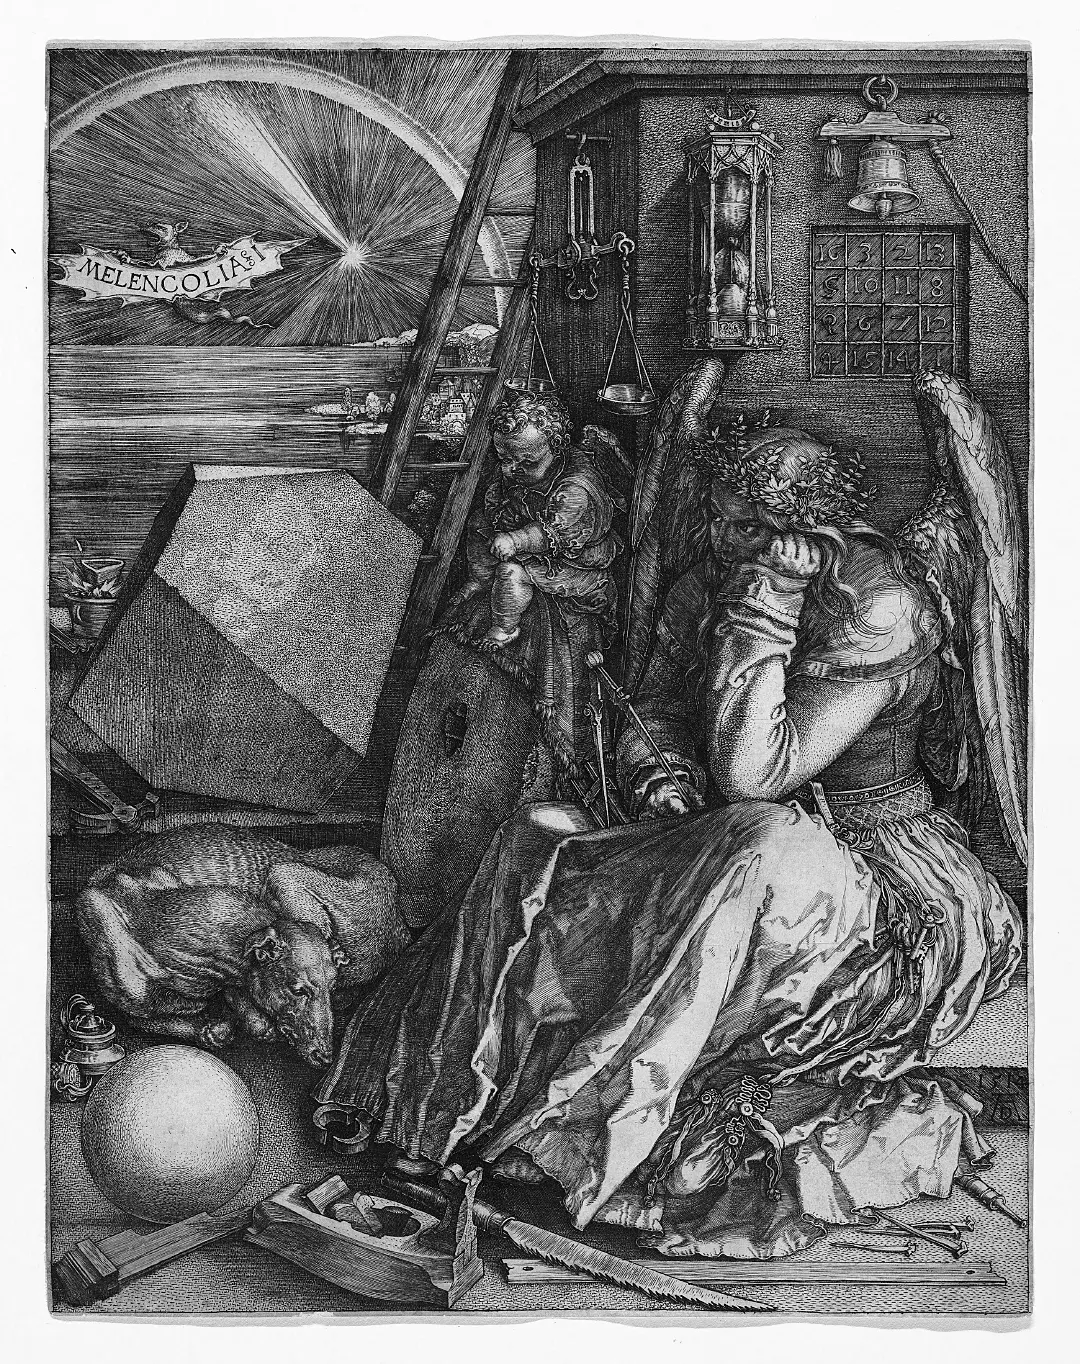
“Melencolia I,” engraving by Albrecht Dürer (1514). Source: Metropolitan Museum
In the late 15th century, printed science texts such as Euclid's Elements (Erhard Ratdolt, 1482) integrated geometrical diagrams alongside mathematical logic, shaping how abstract concepts were understood. Johannes de Sacrobosco's astronomical works used diagrams to explain celestial mechanics, providing a visual means of understanding complex, invisible systems.
By the 16th century, Albrecht Dürer combined anatomical precision with proportional geometry, exemplified in his Four Books on Human Proportions. These illustrations went beyond artistic representation, offering a form of visual argumentation that influenced both scientific reasoning.
A41_SCI_ILLUSTRATION
A43_GRAPHIC_STATS
The spread of charts and graphs showed how numbers could persuade, but in business and administration another representational shift was underway. Data was no longer simply drawn for clarity — it was tabulated for control. Insurance, railways, and finance began to rely on punched cards and systematic tabulation, turning the grid itself into the medium through which commerce was represented and managed.
A43_GRAPHIC_STATS
Visualizing Society — Finance, Mortality, and Governance
As statistical thinking matured, so did methods to visualize it. By the 17th century, England’s Bills of Mortality were not only collected but interpreted. John Graunt’s 1662 analysis offered early demographic insights, tracking plague deaths and life expectancy. A few decades later, Edmund Halley’s mortality tables laid the foundation for actuarial science.
In the 19th century, the use of charts and graphs became more systematic. William Playfair’s bar and pie charts helped represent trade balances and budgets. In the U.S., business statisticians embraced infographics to guide decision-making.
Illustration from Willard Brinton’s “Graphic Methods for Presenting Facts” (1914), using the octopus metaphor to depict the complexity and interconnectedness of data. Source: Archive.org
Willard Brinton’s Graphic Methods for Presenting Facts (1914) emphasized that clear representation could shape executive understanding. His manual ranged from simplified charts to complex 3D diagrams, promoting visuals as practical tools for business and government.
A43_GRAPHIC_STATS
A45_TABULATOR_COMMERCE
Visual graphics made data legible at a glance, but they were only one strand of representation. Another lay in the relentless expansion of tabular systems. Where charts translated numbers into shapes, tabulation embedded them into grids that could be standardized, repeated, and scaled. This logic of representation reorganized information, binding business and governance to formats that structured how data could be understood.
A45_TABULATOR_COMMERCE
Tabulating Commerce — Insurance, Railroads, and Beyond
In 1890, Herman Hollerith demonstrated his punch card tabulator to the Actuarial Society of America, marking a pivotal moment in the adoption of data-driven decision-making in business. Insurance companies like Prudential quickly saw the potential and adopted the system to streamline claims processing, though some actuaries, including John K. Gore, developed faster alternatives to Hollerith’s machines.
By 1910, Hollerith’s tabulator was being used by British railways to monitor costs and revenue per locomotive, linking granular data to profit margins. As Hollerith’s company evolved into IBM, the technology spread into European transportation networks — in 1928, Ferrovie dello Stato in Italy began using IBM equipment to manage train schedules and spare parts.
A45_TABULATOR_COMMERCE
A46_MEMEX_VISION
Tabulation standardized the way institutions represented workers, clients, and machines — grids of numbers that could be counted, sorted, and filed. But this institutional logic also exposed a limit: data was organized for bureaucracies, not for individuals.
The question emerged whether representation could be reimagined for personal navigation. From the punch card ledger grew the idea of data trails designed not for control, but for memory and thought.
A46_MEMEX_VISION

MEMEX and the Dream of Personal Data Trails
In 1945, Vannevar Bush envisioned the Memex, a desk-sized device designed to help users link and retrieve vast amounts of information. Users could create personalized trails connecting photos, notes, and documents, anticipating modern hypertext.
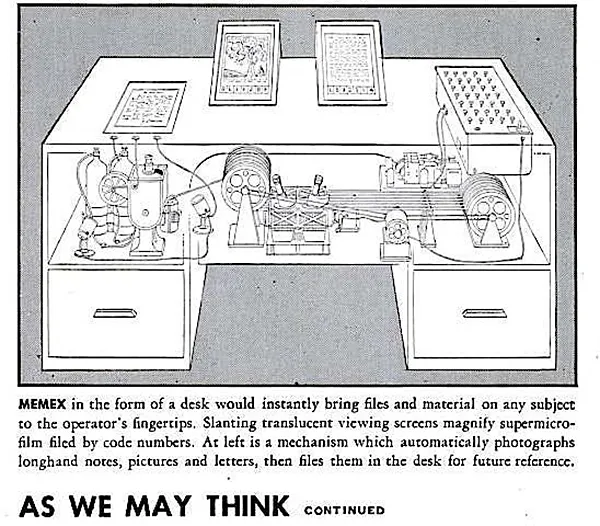
Sketch from Vannevar Bush’s article “As We May Think,” republished in ACM SIGPC Notes (1979). Worrydream
Though never built, the Memex influenced the development of interactive data systems and user interfaces, bridging business data with human memory and creativity. It foreshadowed the personal computer and the idea of navigating data as a cognitive tool, not only storing facts.
A46_MEMEX_VISION
Supercluster B
With the Memex concept, representation crossed a threshold. Information was no longer imagined only as tables, diagrams, or cards, but as trails of association — fluid, personal, and dynamic. The dream of navigating knowledge through linked paths pointed beyond the bureaucratic grid, toward a culture where representation could mirror the movements of thought itself.
***
From ancient ledgers to visionary devices, these episodes show how representation was never a neutral mirror. Each form carried assumptions about what could be known and how it should be arranged.
By the mid-20th century, the languages of representation had multiplied, creating infrastructures of knowledge that were ready to be extended, standardized, and scaled. The next transformations would no longer emerge from single tools or experiments, but from systems designed to hold entire worlds of data.
The Database as Representation — Modeling, Meaning, and Mediation
The first commercial computers made data visible in new ways. UNIVAC encoded alphabetic as well as numeric data, turned population records into forecasts, and broadcast them on television, where machine logic became a language of authority. Ferranti’s Mark I generated tones and even music, suggesting that computation could encode expression as well as numbers.
Representation was no longer confined to diagrams or charts — it was written into instructions, stored on magnetic tape, and projected to audiences well beyond the laboratory. The next step was to formalize these encodings into durable systems: data models, languages, and management tools that could capture not only transactions but the structures of organizations, industries, and states.
B1
UNIVAC and the Languages of Authority
B11_UNIVAC
UNIVAC I — Betting on Electronic Processing
UNIVAC central panel, used by operators to control programs and monitor machine status through switches and indicator lights. Photo by Don DeBold. Source
The UNIVAC I (Universal Automatic Computer I), introduced in 1951, was the first digital computer designed for commercial use in the United States. It was a room-sized system powered by thousands of vacuum tubes, using magnetic tape drives along with punch cards. UNIVAC could execute approximately 1,905 operations per second, and it employed mercury delay line memory capable of storing 1,000 words of 12 characters each.
This hardware allowed UNIVAC to handle both numeric and alphabetic data at unprecedented speeds for its time. It was programmable, universal in purpose, and significantly outpaced earlier mechanical and electromechanical systems.
The machine sold for between $1.25 and $1.5 million, which limited its potential to spread across industries. But its cultural impact was such that it quickly became a symbol of the new era of machine-powered thinking.
B11_UNIVAC
B15_UNIVAC_SYMBOL
UNIVAC’s novelty was representational: the ability to encode both letters and numbers meant that it could speak the mixed language of bureaucracies, contracts, and forecasts.
When UNIVAC processed census data or payrolls, the outcome wasn’t abstract code — it was a formatted output that resembled the very documents people trusted. In this sense, UNIVAC’s breakthrough was not only speed but legibility, making machine logic authoritative outside of engineering circles.
B15_UNIVAC_SYMBOL

UNIVAC as Cultural Symbol
UNIVAC entered public consciousness in 1952, when CBS used it to predict the outcome of the U.S. presidential election. The machine signaled Eisenhower’s victory hours before most commentators were willing to commit, turning a broadcast into a national spectacle. For many Americans, this was the first moment a computer appeared as an authority, its output treated as a credible forecast rather than a technical curiosity.
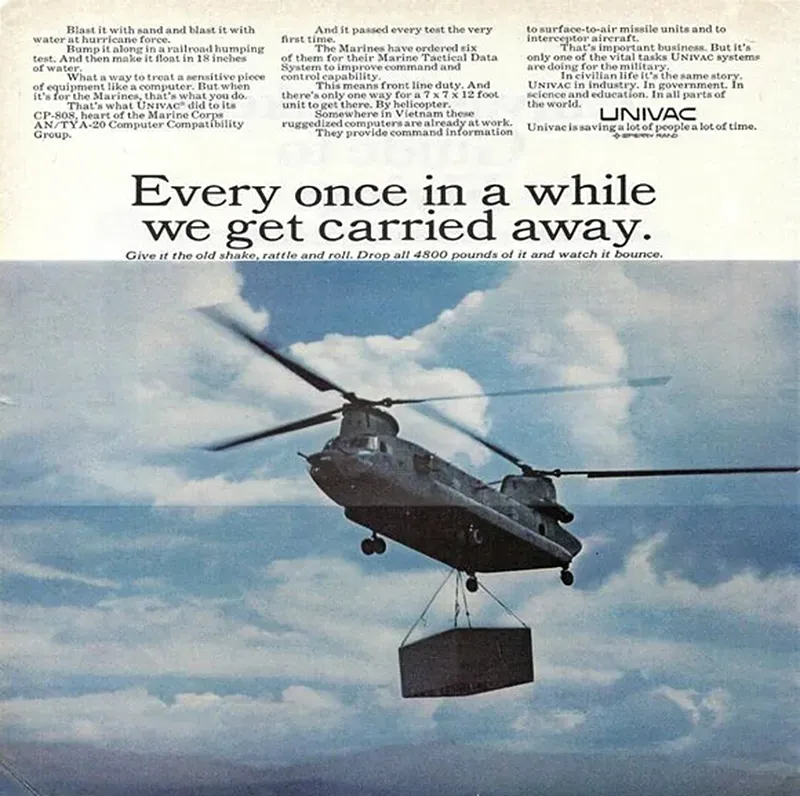
UNIVAC advertisement from “Time” magazine (1967). Source: Poshmark
The UNIVAC name soon spread beyond the machine itself — borrowed in fiction, headlines, and advertising. Its visual form became equally iconic: glowing panels, magnetic tape reels, blinking lights. These elements circulated in media and corporate branding, establishing a recognizable aesthetic of computation in the 1950s and 1960s.
B15_UNIVAC_SYMBOL
B16_FERRANTI
On screen,UNIVAC became an oracle, its blinking lights and paper printouts rendered as signs of cognition. The aesthetic that followed — panels, reels, the hum of logic — was quickly folded into advertising and popular media. It was a style of computation that promised inevitability and progress, part of a broader culture of futurism.
B16_FERRANTI
Ferranti Mark I — Britain’s First Commercial Computer
While UNIVAC made waves in the U.S., the UK had its own breakthrough in 1951: the Ferranti Mark I, derived from the Manchester Mark I project at the University of Manchester. It holds the distinction of being the first commercially available stored-program digital computer — predating UNIVAC by a few months. While primarily delivered to research institutions, it marked the beginning of programmable computing as a product.
The machine was designed to process 20-bit words, with a memory architecture that included vacuum tube storage (each tube holding 64 words) and a magnetic drum with capacity for 512 pages. It sold for between £50,000 and £100,000, and crucially, was made available beyond the confines of academia or government labs.
Alan Turing (right) with the Ferranti Mark I, 1952 — the only known photograph of Turing with a computer. The image appeared on the front cover of Ferranti’s Mark I brochure. Source: Science Museum Group Collection © The Board of Trustees of the Science Museum
The Ferranti Mark I supported a wide range of programs, from business analytics and scientific modeling to experimental computer music and some of the first computer games. Its stored-program design — the ability to modify instructions directly in memory — allowed far more complex data manipulation than earlier fixed-instruction machines.
B16_FERRANTI
Cluster B2
Ferranti Mark I broadened the scope of what machines could symbolize. It could tabulate business records, but it also produced tones, music, and games — computers were beginning to model culture and play, expanding into aesthetic and experimental domains.
B2
Information Inventory — Dreams of Integrated Data
The spectacle of machines as symbols quickly gave way to a different question: how to represent the structure of entire organizations. In the early 1960s, the concept of an “information inventory” reframed data not as scattered files but as a model of the enterprise itself. Every record could be indexed, linked, and retrieved as part of a larger whole.
For managers and engineers, this meant that factories, supply chains, and even economies could be abstracted into digital form.
B21_INFORMATION_INVENTORY
Information Inventory — Toward Integrated Business Data
To make “information inventory” usable, designers emphasized indexing and navigation: maps and keys were imagined as ways to move through an ocean of records.
The urgency of integration grew as industrial systems became more complex: NASA’s Apollo program, for instance, involved millions of components, while military logistics had already outgrown manual handling.
Dow Chemical advertisement, Fortune magazine, October 1963. A two-page spread contrasted IBM’s 7070 punch-card system (“Our model 7070 — It figures.”) with a Dow salesman’s ID badge (“Our model 506713 — He thinks.”), promoting human expertise over machine analysis. Source: Science History Institute
Dow Chemical advertisement, Fortune magazine, October 1963. A two-page spread contrasted IBM’s 7070 punch-card system (“Our model 7070 — It figures.”) with a Dow salesman’s ID badge (“Our model 506713 — He thinks.”), promoting human expertise over machine analysis. Source: Science History Institute
At Dow Chemical and later at General Electric, Charles Bachman faced the limits of separate departmental files. Dow’s early attempts at integration never took hold, but he carried forward the vision of shared, navigable data that could link records across the entire company.
B21_INFORMATION_INVENTORY
B22_BACHMAN_IDS
The idea of an “information inventory” was less about storage than about representation. This shift turned computers into models of enterprise structure, where dependencies and flows could be navigated like maps. The inventory was a new way of imagining a company in data form.
B22_BACHMAN_IDS
Bachman and IDS — Inventing the Network Model
At General Electric in the early 1960s, Charles Bachman led the development of the Integrated Data Store (IDS) — one of the earliest database management systems. IDS introduced the concept of an information inventory: a centralized, disk-based repository of shared records that could be queried and updated by multiple applications.
Walt Disney with GE president Gerald L. Phillipe at the Progressland Pavilion, New York World’s Fair (1964). Source: Smithsonian Institution Archives
This architecture enforced relationships between records — what would later be called the network data model. IDS supported a data dictionary to track record structures and allowed programmers to retrieve or update data using early forms of a data manipulation language.
IDS ran on the GE-225 computer, paired with the MRADS disk system — offering random access to data, rather than the sequential tape storage common at the time. Its first major deployment, MIACS (Manufacturing Information and Control System), provided real-time production control at a GE factory in Philadelphia.
By unifying data storage and enabling shared access, IDS became the prototype for modern database systems. In 1973, Bachman received the Turing Award for this work.
B22_BACHMAN_IDS
B26_GE225_VS_IBM1401
Charles Bachman’s IDS made the information inventory concrete. By defining records and sets, it introduced a grammar for relationships inside data — one-to-many links that captured the dependencies of business processes. For the first time, representation was not only about listing items but about encoding their connections. This allowed factories and enterprises to be seen as structured networks, their flows of materials and decisions mirrored in data models.
B26_GE225_VS_IBM1401
GE-225 vs IBM 1401 — Rival Models of Business Computing
In the early 1960s, two very different machines shaped how organizations approached digital information: the General Electric GE-225 and the IBM 1401.
The GE-225, introduced in 1960, was built for power and flexibility. It featured simultaneous input/output handling, supported both alphabetic and numeric data, and could connect to disk drives like MRADS. Input came from magnetic tape, punched cards, MICR documents, and even paper tape, with long-distance connections supported via the DATANET-15. It was a machine for custom-built systems like real-time data integration.
Meanwhile, the IBM 1401, released in 1959, took the market by storm with its affordability and reliability. Its six-bit character system, magnetic core memory (4K–16K), and decimal arithmetic made it perfect for payroll, billing, and inventory. Leased for around $2,500/month, it brought computing within reach of small and mid-sized businesses — earning the nickname "the Model T of the computer industry."
IBM 1401 computing the results for the city of Kiel, West Germany, during the federal election (1965). Source
Their rivalry wasn’t just about specs — it was about philosophies:
- IBM offered safe, standardized tools for the mainstream.
- GE pushed toward modularity, extensibility, and integration.
The GE-225 later found academic life as well — a time-sharing version at Dartmouth became the birthplace of the BASIC programming language.
B26_GE225_VS_IBM1401
Cluster B3
In the tension between GE and IBM, two futures of representation emerged: one grounded in stability and mass adoption, the other in integration and abstraction. The next step would be to bridge these approaches through language, creating code that could speak simultaneously to managers and machines.
B3
COBOL — From Business Language to Standard
The drive to integrate data models soon ran into a barrier of communication. Business leaders could not read machine code, and programmers could not easily translate institutional needs into low-level instructions. COBOL with its English-like syntax addressed this gap by making data representation much more accessible.
B31_COBOL_CREATION
The Birth of COBOL — A Business Language for All
In May 1959, over 40 representatives from government, industry, and academia gathered at the Pentagon to address a growing problem: early computer languages were difficult to learn and maintain, limiting business adoption. Their solution was CODASYL — the Conference on Data Systems Languages — a volunteer group aimed at creating a common, English-like programming language for business.
Cover of the FLOW-MATIC programming system manual, developed by Grace Hopper at Remington Rand (1958). Source: Bitsavers
At the time, Grace Hopper’s FLOW-MATIC, developed at Remington Rand UNIVAC, was the only business-oriented language using human-readable commands. Hopper, a pioneering computer scientist and naval officer, had long championed making programming more accessible. The committee, with members from Burroughs, Honeywell, IBM, RCA, Sperry Rand, and Sylvania, drew inspiration from her work.
On December 6, 1960, a live demonstration proved COBOL could compile and run the same code on both UNIVAC and RCA systems — a landmark moment for interoperability.
B31_COBOL_CREATION
B32_HARDWARE_OF_COBOL
By borrowing the vocabulary of business COBOL transformed code into documentation: programs were no longer cryptic strings of symbols but structured sentences that described institutional logic. Representation had moved decisively from machine architecture into human-readable form.
B32_HARDWARE_OF_COBOL
Hardware of COBOL — The Machines Behind the Language
COBOL wasn’t designed in a vacuum — it was shaped by the constraints and capabilities of the early business computers it was meant to run on. The language was intended for high-volume, data-driven tasks on large systems like the UNIVAC I and II, IBM 705, Honeywell 800, RCA 501, Sylvania MOBIDIC, and Burroughs B-5000.
Grace Hopper speaking in 1982 about running COBOL and FORTRAN on various machines.
These machines varied widely in architecture and I/O capabilities, but COBOL’s standardization effort required them to speak a shared language. This forced a shift in how hardware designers thought about software compatibility, and it catalyzed interest in portable, high-level languages. The 1960 live demonstration of COBOL running on both UNIVAC and RCA systems proved the concept.
B32_HARDWARE_OF_COBOL
B34_SOVIET_COBOL
COBOL’s ability to cross machines reframed what representation meant in computing. Once programs could run on different platforms, the authority shifted from the physical machine to the language itself.
Business logic was no longer tied to registers or specific devices; it was expressed in portable sentences that described processes in abstract form. This portability reinforced the idea that data representation lived in code and documentation, not in the quirks of individual hardware.
B34_SOVIET_COBOL
COBOL Behind the Iron Curtain — Adaptation and Translation
Despite Cold War tensions, the Soviet Union closely followed developments in Western data processing — and COBOL did not go unnoticed. In 1965, the Kyiv-based journal Kibernetika published a technical overview of COBOL by Lyudmila Babenko, helping introduce the language to Soviet scientific circles. She later earned a PhD for formalizing COBOL-style data translation methods for mass data processing.
Soviet adaptations emerged rapidly: the Dnipro-2 control system, built in Kyiv, integrated COBOL-like translators designed by Kateryna Yuschenko’s team. Meanwhile, the Minsk-22 computer from Belarus offered its own compiler variant. These efforts reflected a broader drive to align with international standards while maintaining domestic engineering autonomy.
Kateryna Yushchenko, member of Victor Glushkov’s pioneering team in Soviet programming. In 1955 she created the Address programming language, introducing indirect addressing nearly a decade before similar features appeared in Western systems. Source: Yushchenko family archive
The arrival of the ES EVM (Unified System of Electronic Computers), based on IBM System/360, brought COBOL-style programming into the mainstream of Soviet and Eastern Bloc computing. By 1975, COBOL had received an official Soviet standard.
B34_SOVIET_COBOL
B35_COBOL_READABILITY_INTERFACE
In the Soviet Union, COBOL became a test of how representation traveled across political and linguistic borders. Translators and compiler variants reworked the language for local hardware, while journals and technical manuals adapted its vocabulary to different scientific traditions. What persisted was the model of legible business logic: programs as structured narratives of records and transactions.
Even in contexts where ideology resisted Western imports, COBOL’s representational form — words that encoded organizational processes — proved too useful to ignore.
B35_COBOL_READABILITY_INTERFACE

COBOL as Interface — Programs in Plain English
COBOL’s breakthrough was linguistic. Business software could now be written in something resembling natural English, with syntax drawn from everyday office practice. Instead of abstract math or dense assembly, programmers used phrases like MOVE TOTAL TO SUMMARY-TOTAL. This made programs legible to non-programmers and reframed coding as documentation.
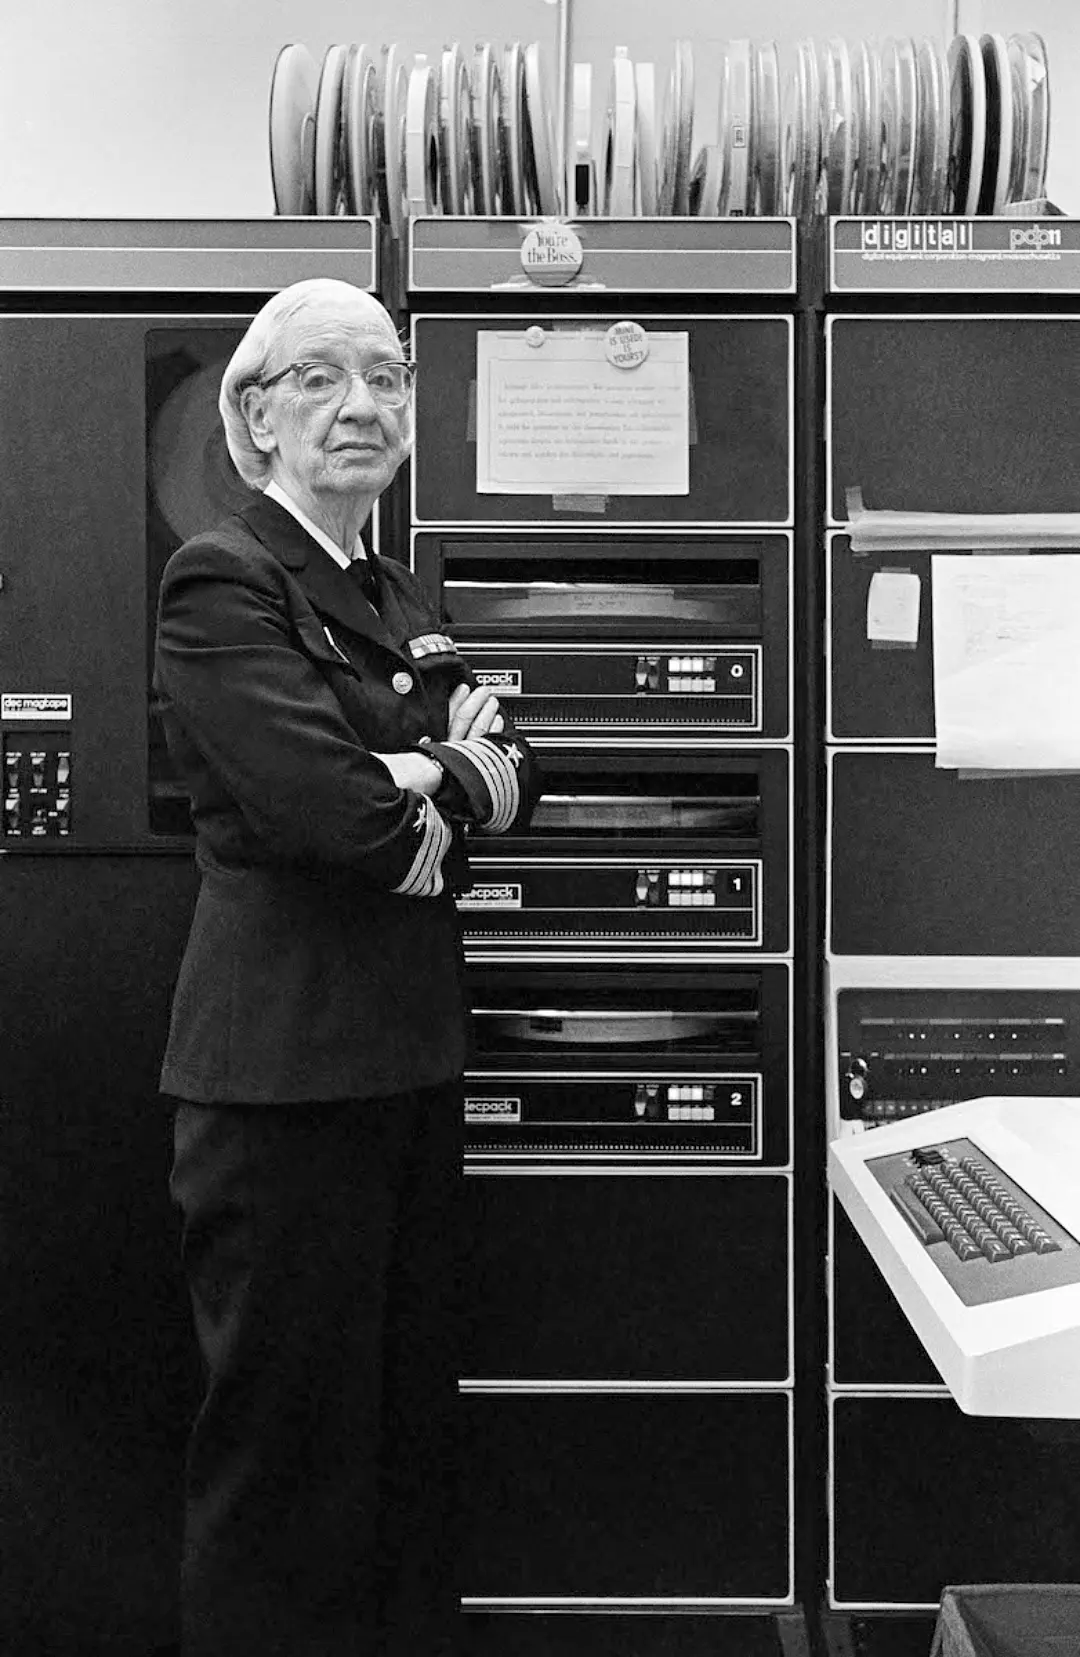
Grace Murray Hopper, Rear Admiral and computer pioneer, in her Washington, D.C. office (1978). She often lectured in uniform, using her Navy role to underscore authority in a male-dominated field, though in everyday work she wore civilian clothes. Photograph by Lynn Gilbert. Source
This readability was deliberate. Grace Hopper and the CODASYL committee wanted software to be transparent, teachable, and aligned with how people already communicated. By borrowing vocabulary and structure from business memos and accounting reports, COBOL positioned itself as a mediator between humans and machines.
B35_COBOL_READABILITY_INTERFACE
Cluster B4
Once business rules could be written in sentences, software began to function like a contract that managers and auditors could trust. What had started as code now circulated as institutional language, ready to be scaled.
B4
Business — Data Management — Systems, Standards, and Scale
As businesses adopted programming languages and data models, the focus shifted from writing software to governing information itself. Reports, once the final product of a process, became entry points into larger stores of data.
The emerging idea of a “database” was less a machine feature than a representational system: a way to ensure consistency, accessibility, and authority across organizations. Information now had to be maintained as an asset — structured so it could be recalled, recombined, and acted upon.
B41_DBMS_EMERGENCE
Managing Data — From Reports to Databases
In the early 1960s, computing began to move beyond producing static reports. Organizations were starting to manage dynamic, shared datasets. The first genuine database management systems (DBMSs) — GE’s IDS (1964) and IBM’s IMS (1965) — were built for disk drives and introduced persistent, structured storage that could be reused across applications.
The concept of a “database” itself came out of Cold War defense projects. In 1962, the System Development Corporation, which had worked on the SAGE air defense network, described shared repositories of information accessible to multiple users and programs — a step beyond archived output.
Airman First Class Trent Bailey, weapons controller technician, with Airman Toni Bailey, a new SAGE surveillance operator, Luke Air Force Base, Arizona (1975). NORAD newsletter archive. Source: Southwest Museum of Engineering,Communications and Computation
By the late 1960s, business computing circles were converging on the same need for consistent storage and retrieval. The CODASYL Data Base Task Group, backed by firms such as RCA and Remington Rand, began formalizing DBMS architecture. Their work intersected with advances in software portability and the push for standard program–data interfaces.
B41_DBMS_EMERGENCE
B45_OLYMPICS_DB
The shift from reports to databases meant that representation was no longer a static product but a dynamic resource. It allowed managers to return to the same body of information, query it from new angles, and generate fresh accounts without repeating the underlying work.
B45_OLYMPICS_DB
Tokyo Olympics 1964 — Real-Time on a Global Stage
The 1964 Tokyo Olympics posed a monumental data challenge: 7,000 athletes, 100 countries, and up to 25 simultaneous contests across 32 venues. To manage this, IBM Japan deployed a real-time data processing system that transformed event coordination forever.
Data-printing center in the Olympic Village, Tokyo (1964). Source: Official Games Report
Using 62 IBM 1050 terminals across venues, scores were sent to a central Olympic Data Center powered by eight IBM computers. With a disk capacity of 56 million characters, the center processed rankings, judge scores, and registration data for 12,000 participants — within seconds. Over 100,000 messages were expected, with three to four times as many replies sent back.
B45_OLYMPICS_DB
Cluster B5
The Olympic Games revealed how databases and real-time systems could act as global displays. Events were instantly processed, tabulated, and broadcast across the world. Representation meant simultaneity: information delivered fast enough to feel immediate, yet structured enough to be trusted. What had begun as isolated printouts in offices now unfolded as a coordinated flow of data on an international stage.
B5
Foundations of Data Handling — From Batch Runs to Transactions
The promise of integrated databases and real-time systems depended on more basic questions: how to store, verify, and display information so that people could trust it. In the 1950s and 1960s, programmers tackled these issues at the ground level, shaping the everyday routines that kept data usable.
Standards for integrity prevented duplication and error. Tabulation and reporting aligned results with familiar formats. Pre-graphical displays gave text and numbers a recognizable structure, while new data structures underpinned every operation. These building blocks turned raw computation into reliable representation.
B52_DATA_INTEGRITY
Data Integrity — Redundancy, Consistency, and Security
In the early years of digital computing, businesses faced a fundamental problem: data was everywhere, and nowhere unified. The same customer’s name or address might live in multiple departmental files, each updated (or not) independently. This data redundancy consumed storage and bred inconsistency. A change made in sales might never reach accounting or shipping.
80-column punch card printed at the Tehnoinform facility, Riga, USSR (1976). Source: Tristan Davey’s Punchcard Archive
The emergence of Database Management Systems (DBMS) in the 1960s — such as GE’s IDS and IBM’s IMS — centralized data storage, enabling multiple applications to access the same version of a record.
Centralization also raised the stakes. Errors in one place could propagate everywhere, making data integrity critical: records had to be valid, correct, and complete. Fields were expected to follow strict rules — for example, prices had to be numeric and dates had to conform to valid calendar values. As data became more valuable, concerns about security also grew.
B52_DATA_INTEGRITY
B53_REPORT_TABULATION
Standards for integrity reframed what representation meant in computing. A dataset that contained errors or duplications no longer counted as reliable information. Ensuring consistency turned raw records into something authoritative, capable of standing in reports and guiding decisions. Integrity procedures protected systems from breakdown but in the first place, they defined what it meant for data to be valid.
B53_REPORT_TABULATION

Reporting and Tabulation — Early Business Intelligence
Before the rise of graphical interfaces and data dashboards, businesses made sense of information through structured printouts — organized columns of numbers, names, and dates. This was the world of reporting and tabulation, where value lay in turning raw machine data into readable summaries.
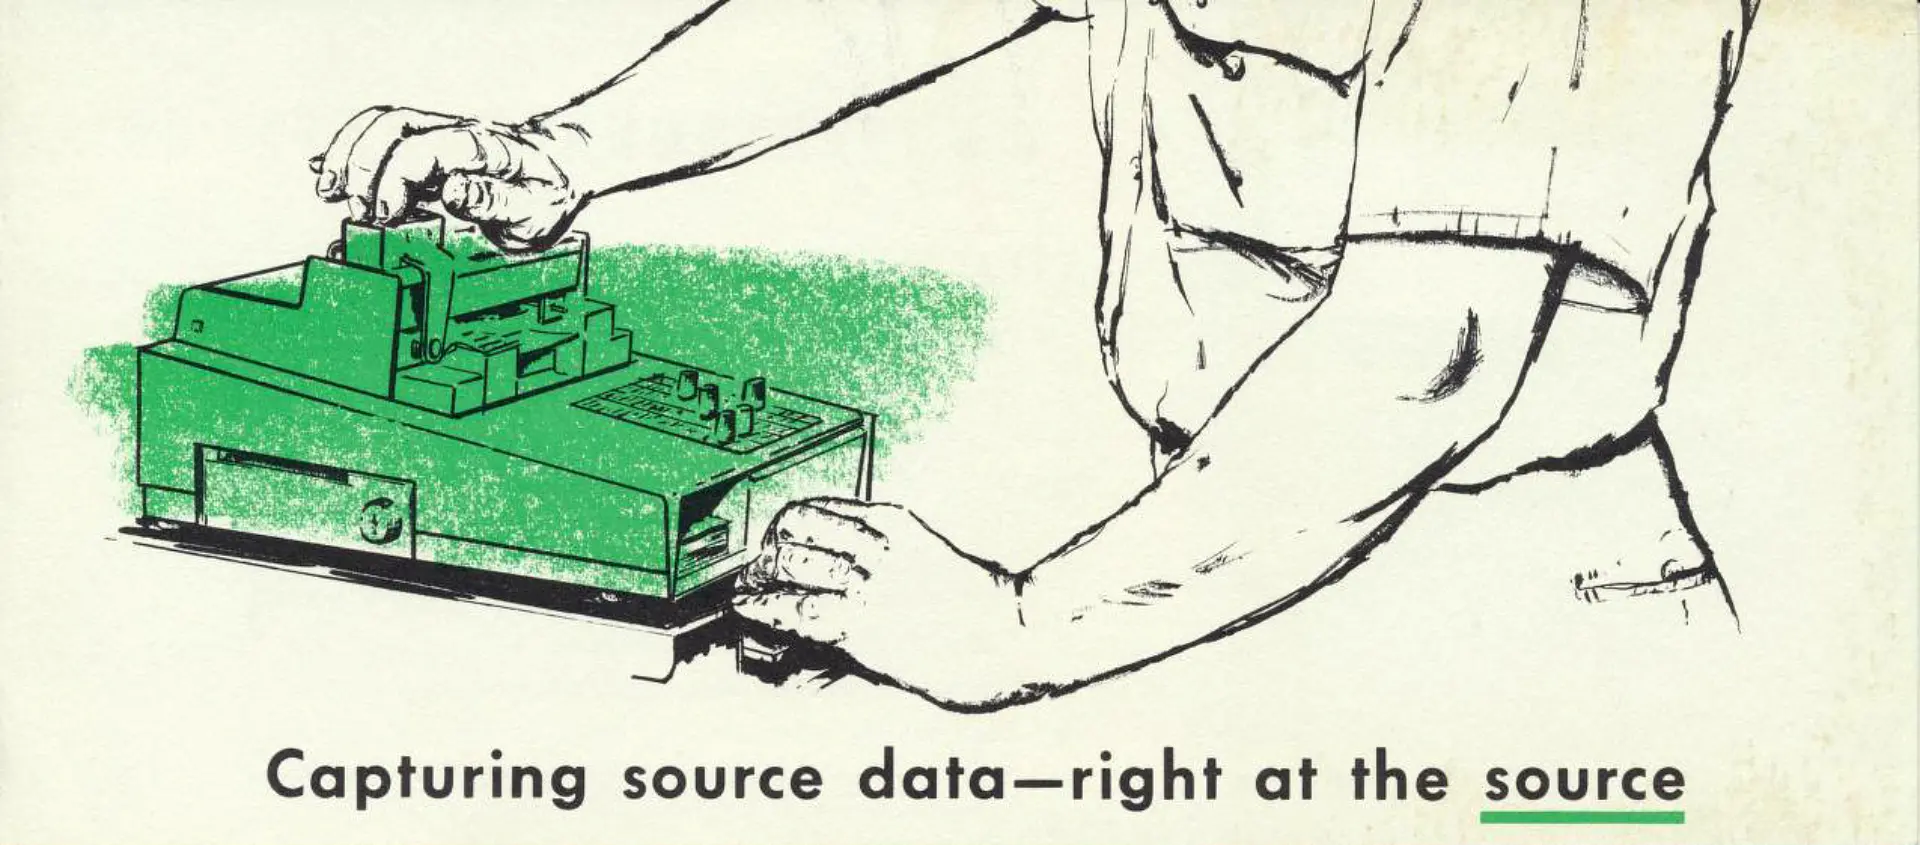
Brochure page for the Portable Addressograph, Addressograph-Multigraph Corp. (1950s). Source: Internet Archive
Computing’s main output in this era was text, and layouts were built with typewriters and line printers. Custom-coded routines used spacing and symbols, inserted headers, pagination, totals, and alignment, giving readers a way to scan, compare, and analyze continuous-form paper visually.
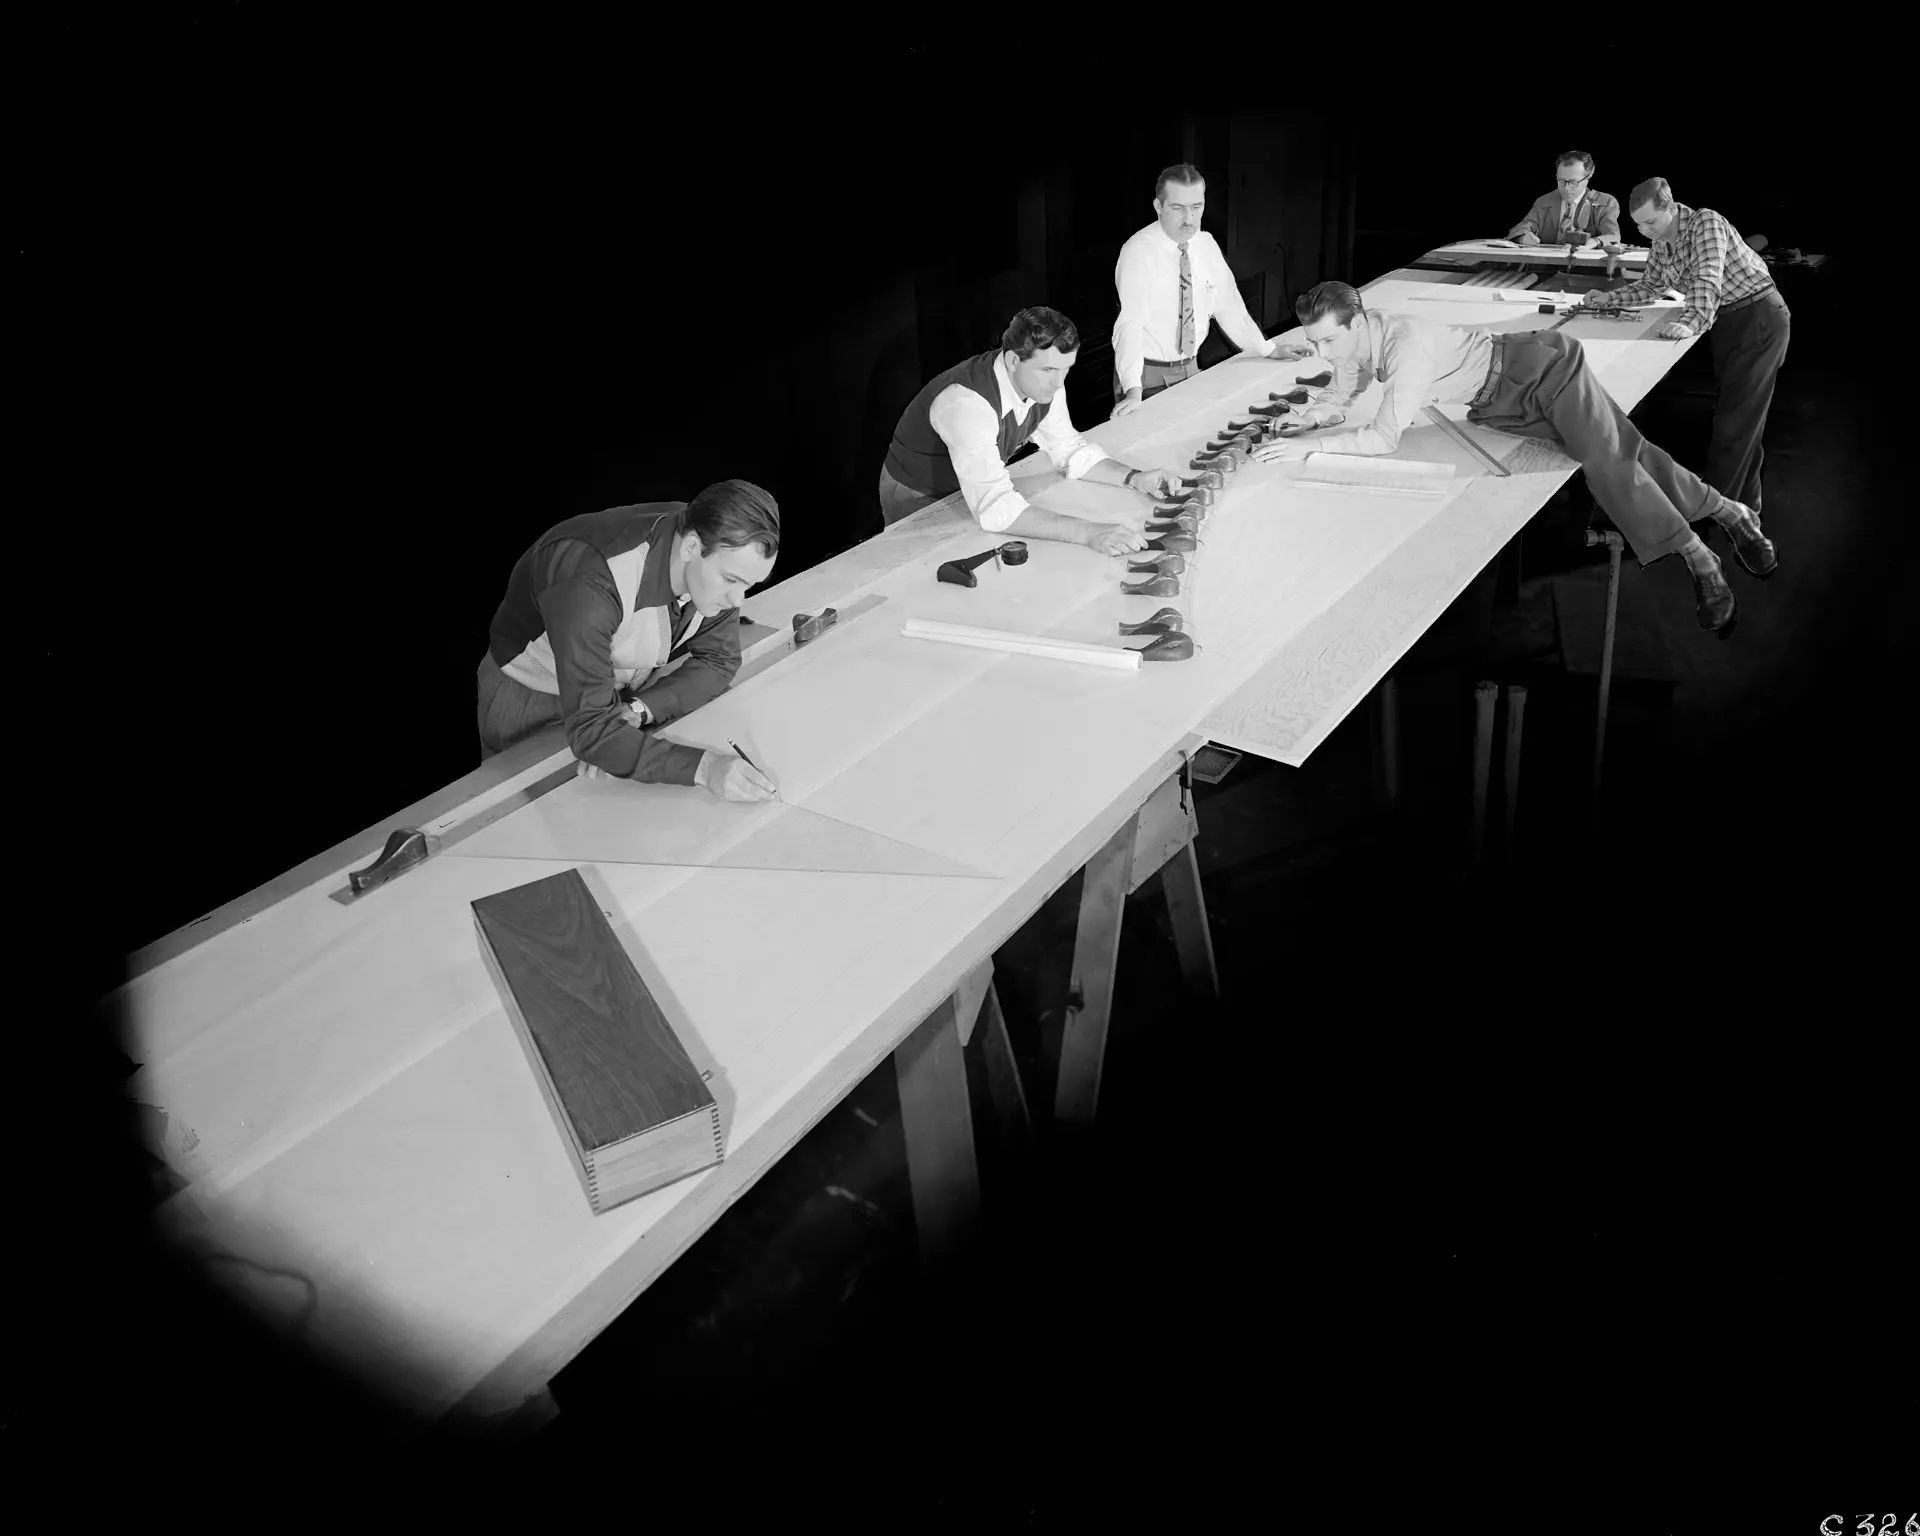
Draftsmen working on a blade template drawing at a large table (1953). Source: NASA/Glenn Research Center collection
Even without graphics, sales reports, inventory sheets, and payroll summaries transformed raw bits into managerial knowledge. The software behind these outputs became precursors to later business intelligence tools.
B53_REPORT_TABULATION
B55_EARLY_STRUCTURES_ALGOS
Formatted printouts became the first human-readable layer bridging raw computation and managerial action. Tabulation, long familiar from ledgers and censuses, now became the medium through which computers spoke. The conventions of later dashboards and graphics were seeded here — in printouts that suggested order and pattern even without images.
B55_EARLY_STRUCTURES_ALGOS
Organizing Information — Data Structures and Algorithms
While interfaces determined how people spoke to machines, the machines themselves needed internal structures to manage information once it was loaded. Early programmers discovered that efficiency depended not only on commands, but on how data was arranged in memory.
The first systematic solutions were data structures. Arrays assigned each item to a fixed slot in memory, like numbered positions in a filing cabinet — quick to access but inflexible. Linked lists, by contrast, let each record point to the next, forming a chain that could grow or shrink as needed. Together, they gave programmers reliable ways to store and retrieve data on machines with limited resources.
Processing required algorithms — step-by-step procedures for sorting, searching, or merging records. A payroll system, for example, depended on routines to alphabetize employees or locate specific names. These instructions were hard-coded in assembly or other low-level languages, demanding technical skill to write and maintain.
Later, thinkers such as Donald Knuth and Niklaus Wirth codified these ideas in textbooks and programming languages, ensuring that structures and algorithms became the foundation of computer science education and practice.
B55_EARLY_STRUCTURES_ALGOS
Supercluster C
Data structures defined how information would appear inside the machine. The choice of structure determined whether data seemed sequential, hierarchical, or relational once it emerged in human-readable form. Representation began in the invisible architectures with algorithms working as the hidden narrators, deciding which records to surface and how to order them.
The Relational Model — Representation Through Tables and Rules
COBOL had already shown that machines could be addressed in near-English, but it left data itself tangled in redundant files and rigid hierarchies. The decisive shift in representation came when Edgar Codd reframed information not as storage layouts but as relations — tables of rows and columns, bound by logic rather than location.
Representation became a grammar for data itself — one that promised independence from hardware, portability across platforms, and a universal way to describe meaning inside the machine.
C1
Edgar Codd and Relational Revolution
C11_CODD_RELATIONAL
The Relational Breakthrough — Codd’s 1970 Paper
After serving as a WWII pilot, Edgar F. Codd returned to Oxford for a mathematics degree and later joined IBM in the U.S. In the 1960s, he developed software for the IBM 7090 mainframe — systems deeply tied to physical data structures. At IBM’s research lab in San Jose, California, he advanced a new idea: databases should represent information using only data values, not pointers, hierarchies, or physical record order.
His 1970 paper, A Relational Model of Data for Large Shared Data Banks, introduced the concept of data independence — separating logical data relationships from how data is physically stored. This allowed users to pose declarative queries without understanding the internal structure. It laid the foundation for SQL and shifted database design from hardware-bound logic to abstract, high-level models.
Although the mathematical style puzzled many readers — even IBM engineers admitted they “couldn’t make heads or tails” of it — the paper defined a new direction for database research. In 1981, Codd received the Turing Award for this contribution.
C11_CODD_RELATIONAL
C14_CODD_RULES
Database management systems contributed to making data a corporate resource. As Bergin and Haigh observe, DBMSs “existed both as a tangible technology (…) and as the symbol of a movement to raise the status of computing within the managerial world.” This was the cultural soil in which Codd’s proposal took root.
Codd’s 1970 paper planted the model, but it was still abstract: relations, tuples, domains. To make it usable, those ideas had to be spelled out as rules. The move from principle to prescription was itself a form of representation — a way of turning mathematical theory into something engineers could check, argue over, and eventually implement.
C14_CODD_RULES

Codd’s 12 Rules — The Blueprint for Relational Databases
As vendors rushed to sell products branded “relational,” Edgar Codd intervened to separate marketing claims from architecture. In two Computerworld articles (October 14 and 21), he introduced a framework for judging whether a system truly followed relational principles.
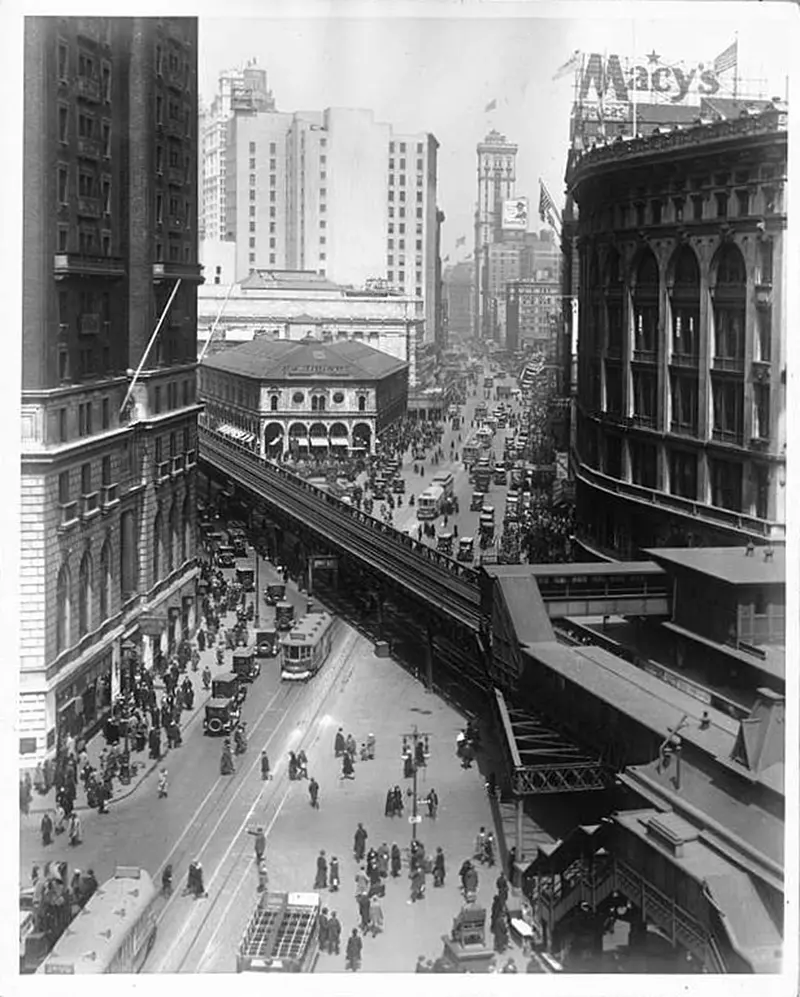
Herald Square elevated railroad and Sixth Avenue with R.H. Macy & Company department store in the background, New York (c. 1910s–1930s; published 1949). After emigrating from England, Edgar F. Codd briefly worked in Macy’s men’s department before turning to computing; within two decades he introduced the relational model and later received the Turing Award for it. Source: Library of Congress, Prints & Photographs Division, Detroit Publishing Company Collection
Codd’s 12 rules — actually 13, counting Rule Zero — outlined what a genuine relational database must provide. Rule Zero required that a DBMS manage data strictly through relational methods, not as a façade over hierarchical or network systems. The remaining rules specified fundamentals such as data independence, accessible metadata, set-based operations, and logical consistency.
One practical rule emphasized multiple-record-at-a-time processing: a single command should update entire sets — raising all prices by 10% or changing every Polish address to “Warsaw, Poland.” This stood in contrast to earlier one-record-at-a-time approaches.
C14_CODD_RULES
Cluster C2
Codd’s rules were never enforced by standards bodies, yet they became a cultural benchmark. They gave engineers, vendors, and users a checklist against hype, a way to say what counted as relational and what did not. In doing so, they anchored the model in practice — a shared framework that would be cited, debated, and tested across decades.
Codd’s terminology was mathematical, but its impact was practical. What he called relations and domains became “rows” and “columns,” representations that managers and programmers could recognize. Later refinements like Peter Chen’s entity–relationship diagrams extended the model visually, showing how structure itself could serve as a medium of communication.
C2
Practical Birth of Relational Databases
Turning relations into working systems meant building a language that people could read and a storage engine that could deliver results. System R was IBM’s attempt to translate Codd’s abstract grammar into something operational.
C21_SYSTEM_R_CONCEPT
System R — Bringing the Relational Model to Life
By the mid-1970s, IBM’s San Jose Research Lab launched a bold experiment: could Codd’s abstract relational model actually work in practice? The answer was System R, a prototype designed to show that a relational database could offer full production functionality without sacrificing performance.
The project began in 1974, led by Don Chamberlin, Ray Boyce, Irv Traiger, and Morton Astrahan — though Codd himself watched it from the side. Chamberlin later remarked, “He really didn’t get involved in the nuts and bolts of System R very much. I think he may have wanted to maintain a certain distance from it in case we didn’t get it right. Which I think he would probably say we didn’t.”
San Jose City Lines bus, GM “Old Look” (early 1970s). IBM engineers commuted past a city in rapid urban transformation. Source
System R unfolded in stages. Phase Zero tested the feasibility of a relational language — SEQUEL (later SQL) — using early prototypes. By 1976, the team had demonstrated SQL’s potential to make databases accessible to non-programmers. Internally, the project split into two groups: the Relational Data System (RDS) focused on language and query logic, while the Research Storage System (RSS) tackled data handling, transactions, and concurrency.
System R was both a proof of concept and a development engine: it validated that a declarative approach to data could scale and laid the groundwork for a new generation of commercial database products.
Cover of the pulp novel The Penetrator #30: Computer Kill (1980) by Lionel Derrick (Chet Cunningham). The story follows a rogue engineer sabotaging banking systems through computers. Published as relational databases entered commercial use, it reflects how data systems were already imagined as both infrastructure and threat. Source: Biblio
C21_SYSTEM_R_CONCEPT
C23_SYSTEM_R_ANECDOTES
For representation, the release of System R was decisive: relations appeared directly in the outputs and routines that users handled, shaping how information itself was conceived.
C23_SYSTEM_R_ANECDOTES

Tales from the SQL Team — Memory, Humor, and Liquor Walls
System R’s developers left behind stories that were as colorful as their code. Don Chamberlin recalled a memorable visit to Upjohn Pharmaceuticals in Kalamazoo, Michigan — where the team had installed System R to manage clinical research data. Their hosts lodged them in a Victorian mansion with tandem bikes and a full liquor wall: “We asked if we could take home anything we didn’t drink.”
Company sign spotted by System R engineers during a tour of the vitamin production line (late 1980s). Source: Upjohn
Beyond these surreal moments, IBM tested System R in diverse settings: attack helicopter design at Owego, GUI prototypes at the Santa Teresa Lab, and natural-language querying in the REQUEST project at Yorktown. International installations extended its reach from Tokyo to Heidelberg.
C3
SQL and the Language of Databases
Instead of guiding machines step by step, SQL declared what result was wanted and left the system to determine how to get it. Representation itself became the interface: queries were sentences, results became dialogue. With SQL, the relational model turned from a technical framework into a communicative medium that business, science, and government could all adopt.
C31_SQL_CONCEPT

From SEQUEL to SQL — Making Relations Speak
SQL began as a bold attempt to turn Ted Codd’s mathematical vision into something users could actually type. In the early 1970s, Don Chamberlin and Ray Boyce designed SEQUEL — a query language built not on logic symbols, but on readable templates like “SELECT” and “FROM.”
The language pioneered a declarative style: describe the data you want, rather than the steps to retrieve it. SEQUEL’s syntax mimicked English and allowed queries to be composed like building blocks. It was designed as a bridge for analysts, scientists, and business users, not programmers alone.
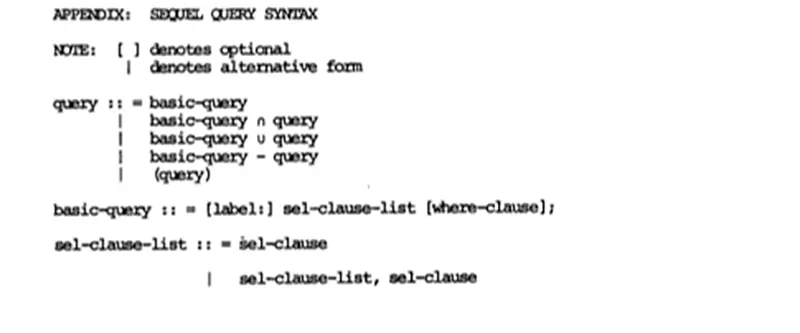
Query templates from the article “SEQUEL: A Structured English Query Language” by Donald Chamberlin and Raymond Boyce, showing how relational operations were expressed in readable, English-like statements. Source
The name “SEQUEL” was shortened to SQL after a trademark dispute with British aerospace firm Hawker Siddeley. Don Chamberlin recalls dropping the vowels to echo languages like APL.
While SQL began as an internal IBM research effort, it was soon picked up in academic experiments and commercial projects alike, laying the foundation for relational databases as everyday tools.
C31_SQL_CONCEPT
C32_SQL_IMPLEMENTATIONS
SQL queries looked less like engineering instructions and more like structured sentences. This turn marked a new layer of representation: information could now be asked for, combined, and compared through dialogue, not circuitry.
C32_SQL_IMPLEMENTATIONS
Early Implementations and Common Patterns
IBM prepared SQL for enterprise deployment with SQL/DS (announced in 1981) and DB2 (released in 1983), adapting relational concepts for large-scale business use.
Meanwhile, Oracle — founded by Larry Ellison, Bob Miner, and Ed Oates — seized the opportunity to commercialize relational ideas. Its second release, Oracle V2 in 1979, was the first SQL-based RDBMS available on the market. Built not on IBM’s source code but on published research about System R, it proved that relational design could be replicated and sold outside the labs.
Oracle 4.1 start screen, restored on DOS by Carel Jan Engel and Marco Gralike (2005) — a glimpse of how early SQL-based systems appeared to users. Source
SQL also gained traction in universities, where it was integrated into teaching tools and research systems. Students and researchers learned to write short, declarative statements — a style of interaction that began to define how users expected databases to work.
C32_SQL_IMPLEMENTATIONS
C33_SQL_STANDARDIZATION
SQL became the representational layer that outlived machines, projects, and even vendors. Once Oracle, IBM, and academics alike spoke its syntax, queries turned into a portable script for meaning inside organizations.
C33_SQL_STANDARDIZATION
SQL Becomes the Standard
In 1986, the American National Standards Institute (ANSI) ratified SQL as the official database language, followed by the International Organization for Standardization (ISO) in 1987. This recognition established SQL as a common interface across vendors and platforms, fixing its role at the core of relational computing.
Federal Information Processing Standards Publication (1986), establishing SQL as a database language. Issued by the U.S. National Bureau of Standards. Source
The first standards, SQL-86 and SQL-89, defined a common core for queries. SQL-92 expanded the scope with features like outer joins, richer data types, and stricter rules of syntax. Later editions — SQL:1999, 2003, and beyond — layered in recursion, triggers, procedural logic, and eventually XML and JSON support, turning SQL into a full-fledged data manipulation language.
The drive toward standardization combined technical aims with commercial strategy. Vendors like IBM, Oracle, and Sybase backed SQL to ease adoption and reduce customer lock-in, even while promoting their own proprietary extensions. Academic systems and open-source projects followed the same path, ensuring that generations of developers learned SQL as a shared skill.
Critics — including Chris Date, one of Codd’s closest collaborators and most influential educators — argued that SQL strayed from relational purity. Yet its adoption was unstoppable: SQL became the de facto language of enterprise computing, not because it was flawless but because it was everywhere.
***
SQL’s triumph lay in becoming the universal medium of representation. Standardization cemented this role: tables and queries became the common voice through which institutions described and exchanged information.
C33_SQL_STANDARDIZATION
Cluster C4
SQL’s triumph lay in becoming the universal medium of representation. Standardization cemented this role: tables and queries became the common voice through which institutions described and exchanged information.
C4
Commercial Expansion of Relational Systems
Relational databases moved from research into markets, where their value was measured in contracts, competition, and publicity. Vendors translated abstract models into products that executives could buy and audiences could trust.
In this shift, representation expanded beyond schemas or commands. Databases became commercial symbols, advertised and branded as tools of efficiency, reliability, and modernity.
C43_ORACLE_CIA

Intelligence and Influence — The CIA’s Database Bet
Oracle’s roots trace back to a mix of military contracting, academic research, and Silicon Valley opportunism. Before founding Oracle, Larry Ellison and Bob Miner worked at Ampex, a CIA contractor developing software to manage and retrieve classified information. One of its projects carried the codename “Oracle” — a label Ellison and Miner later kept when they launched Software Development Laboratories (SDL) in 1977.
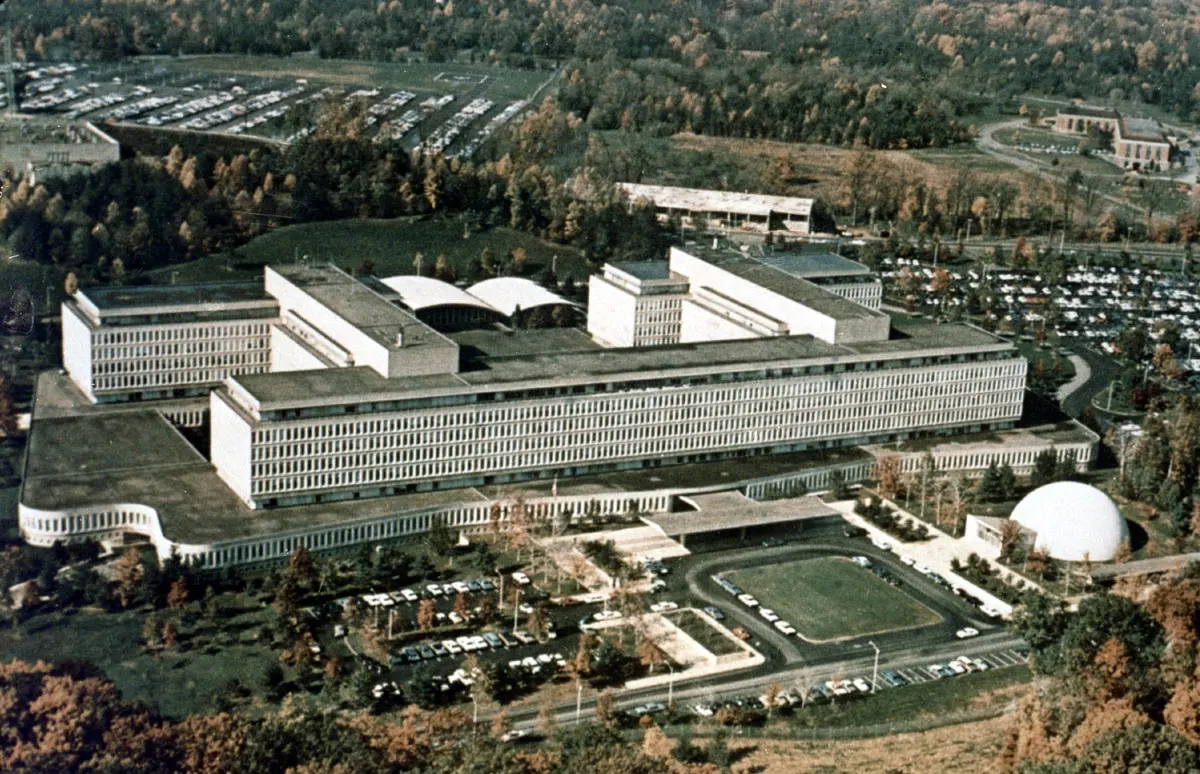
CIA Headquarters, Langley, Virginia (c. 1979). The agency’s internal project codenamed “Oracle” inspired Larry Ellison’s company name and marked the intersection of espionage and early relational databases. Source: Washington’s Top News
C43_ORACLE_CIA
C44_RDBMS_ADVERTISING
What began as an academic proposal now carried institutional weight. Relational systems had proven themselves not only in corporations but in the infrastructure of intelligence. The next step was persuasion at scale: ads, campaigns, and slogans.
C44_RDBMS_ADVERTISING

Selling the Relational Future — Ads and Market Adoption
As relational systems entered the commercial mainstream, vendors competed on perception as much as on performance. In the late 1970s and early 1980s, ads from IBM, Oracle, and Honeywell translated the relational model into strategic narratives aimed at executives and IT buyers.
Trade journals like Computerworld, Datamation, and Byte filled with images of smart terminals, confident managers, and futuristic dashboards. Oracle leaned into portability and cost-efficiency; IBM emphasized enterprise reliability and integration; Honeywell pitched MRDS as a secure solution backed by Multics’ reputation.
Oracle “Page Your Oracle” television advert, ITV (1986). Campaigns like this reframed relational systems as accessible business tools, blending technical promise with cultural messaging.
These campaigns bridged the gap between theory and enterprise reality. Marketing turned relational databases into a recognizable symbol of efficiency and modernity.
C44_RDBMS_ADVERTISING
Cluster C6
Oracle, IBM, and Honeywell opened the door to a broader software economy. Startups and university projects expanded the market, and databases began to circulate as part of larger ecosystems.
C6
Foundations of Relational Interaction
By the early 1980s, relational databases were more than products — they were environments of interaction. The commercial push had spread SQL into companies large and small, and the software ecosystem tied it tightly to programming languages and operating systems. But for users, the decisive question was how these systems actually appeared in practice.
Two elements defined that experience. First was the structural grammar of relations themselves — keys, links, and normalization that gave data shape and coherence. Second was the interface: the terminals where queries were typed, results returned, and abstract logic became a working dialogue. Together, these foundations made the relational concept a lived mode of representation.
C61_RELATION_KEYS
Keys and Relations — The Grammar of Structure
The power of the relational model lay in how it connected data. Each row in a table carried a “primary key” — a customer ID, invoice number, or another unique marker. “Foreign keys” pointed from one table to another’s primary key, weaving relationships: an order tied to a customer, a payment linked to an invoice, a student mapped to a course.
PDP-11 brochure cover (1970). Relational concepts such as keys were applied to data managed on systems of this era. Source: Computer History Museum
This grammar of keys enabled normalization — reducing duplication and enforcing consistency across sprawling systems. Instead of repeating the same details in every record, databases stored them once and referenced them wherever needed. Codd’s abstract theory of relations thus became a practical framework for structuring business processes, research datasets, and institutional records.
C61_RELATION_KEYS
C62_SQL_TERMINALS
Relational keys made data intelligible as structured connections, but their logic still had to be seen and worked with. The move from printed reports to interactive terminals brought that structure onto the screen, where links between rows and tables could be queried directly.
C62_SQL_TERMINALS

Screens and Queries — The Early Interface
The relational model didn’t begin with a graphical interface — it began with typed lines on glass screens. Before mice, menus, or dashboards, early relational database users interacted through terminals like the IBM 3270 or DEC VT52, issuing SQL commands in plain text. The user experience was stark: no buttons, no prompts — just blinking cursors and strict syntax.
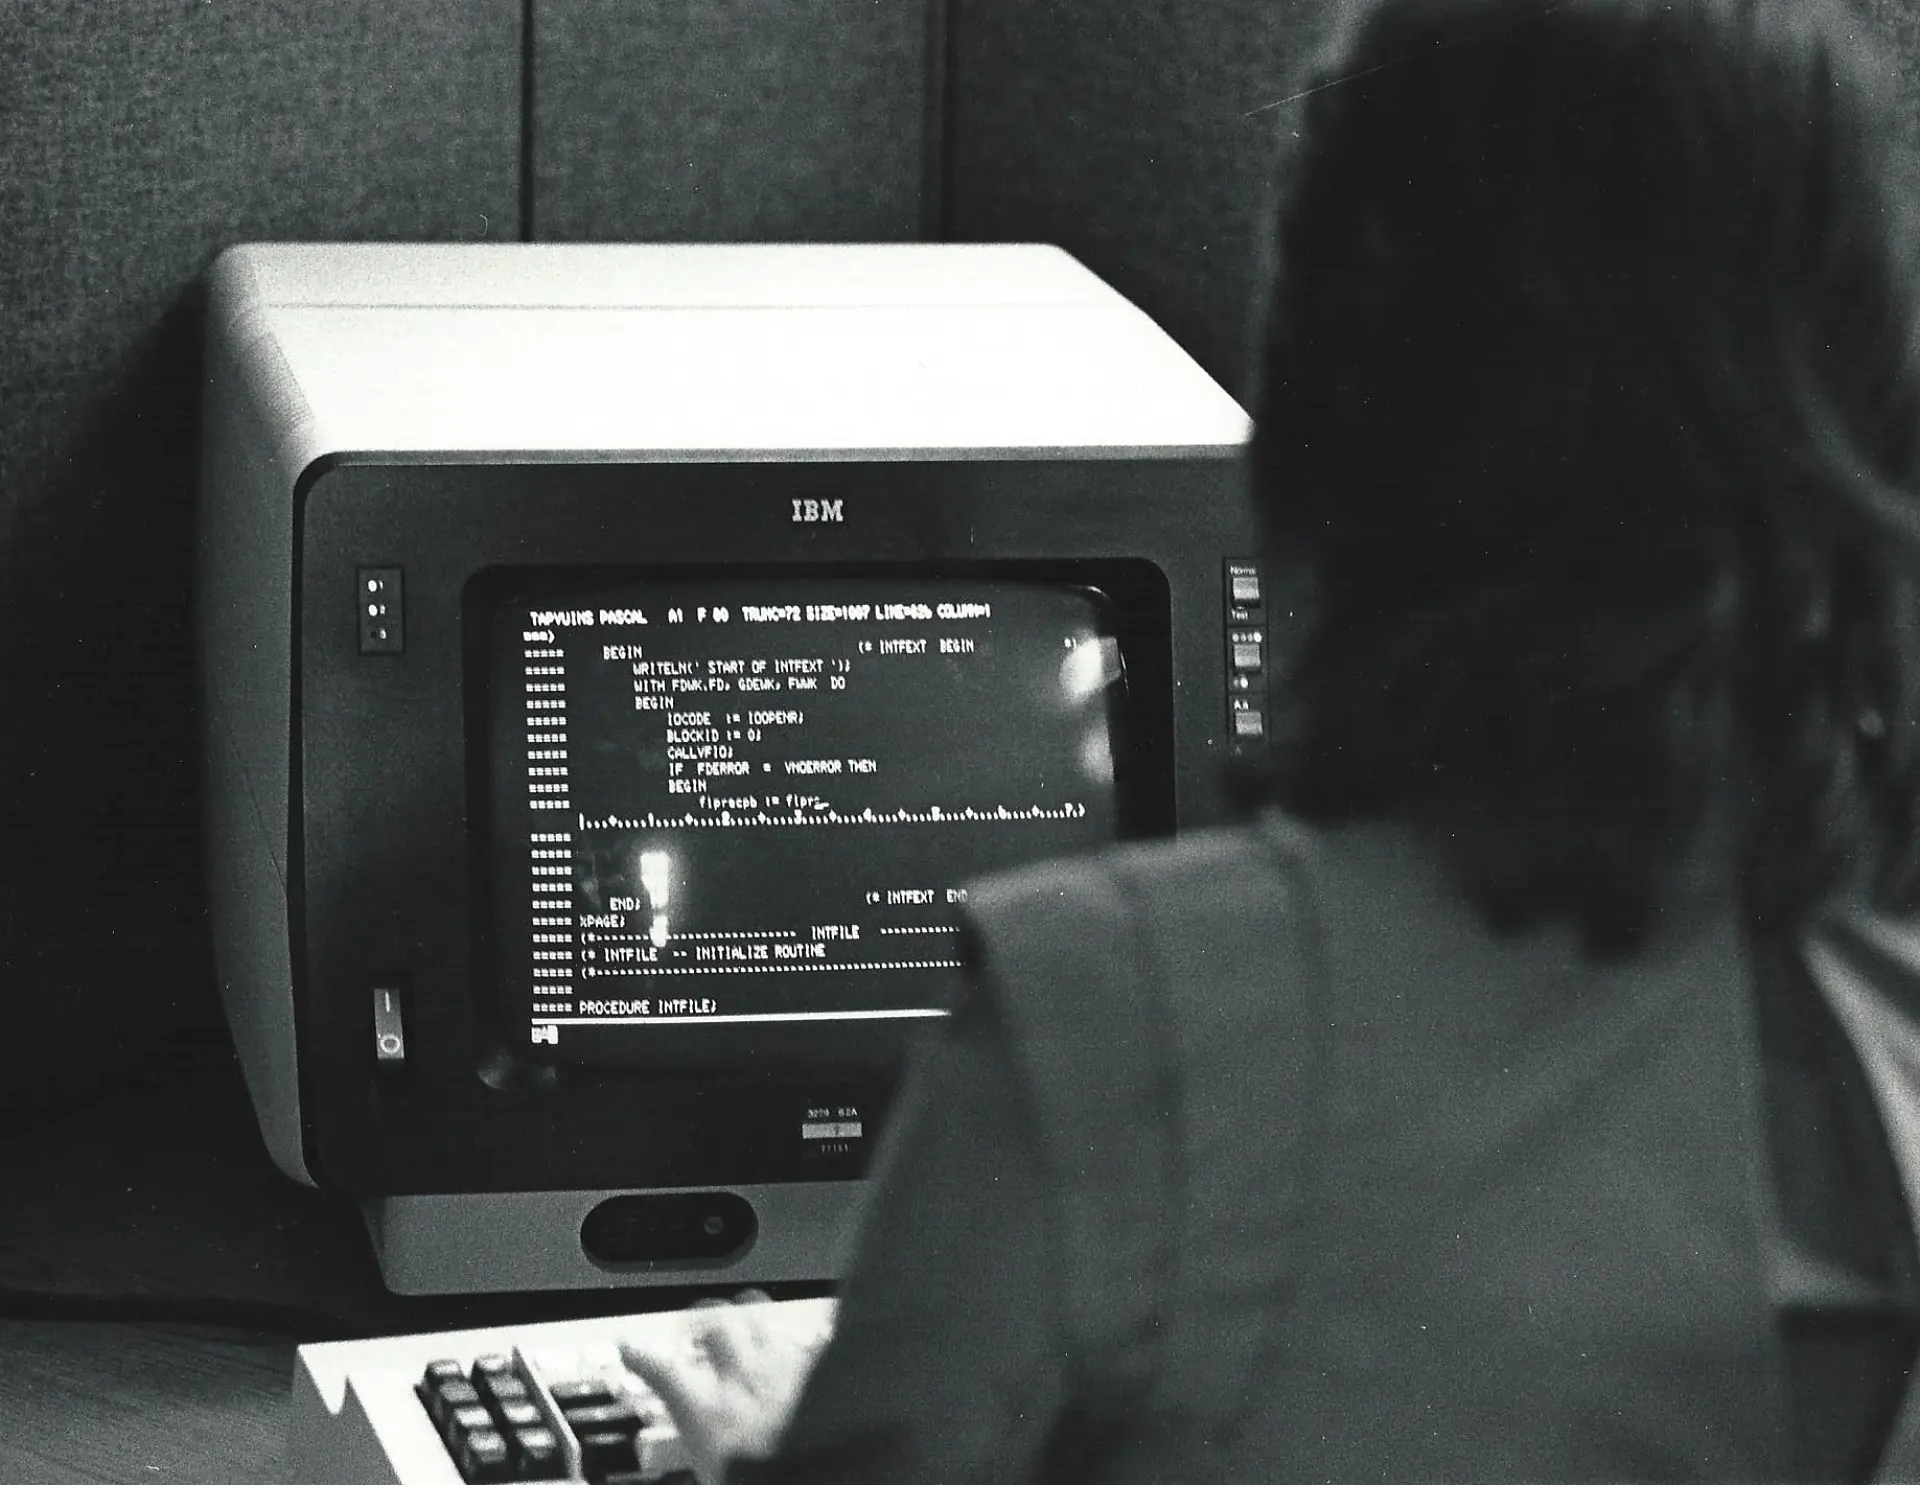
An Informatics General programmer at the company’s New York office, reviewing Pascal code for the TAPS product on an IBM 3270 terminal (1983). Photograph by Jonathan Schilling. Source
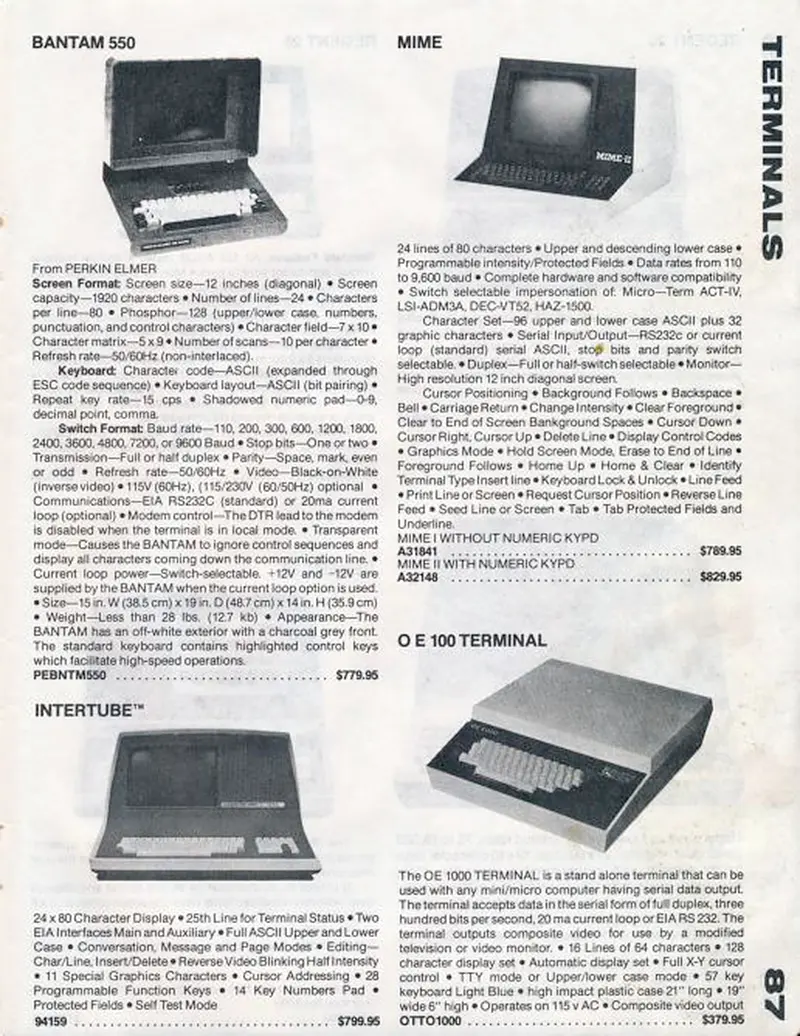
Technical specifications for an early floppy-disk system used with DEC PDP-11 machines, detailing storage capacity (256 KB per diskette), transfer speeds, and physical dimensions. Such austere interfaces — blinking cursors, command lines, and hardware tied to precise limits — framed the early era of relational database use. Source
This minimalist interface reflected the declarative power of SQL itself. Users didn’t instruct the machine how to find data, only what to find. With commands like SELECT, FROM, and WHERE, users could write expressive queries — but only if they understood the structure of the database. In this early phase, accessibility was limited not by technology, but by knowledge.
Still, the separation of logic from layout opened the door to new interfaces. By the 1980s, relational systems would be paired with form builders, report generators, and eventually, GUI-based database tools. But before all that came the terminal — an austere, textual gateway to structured information.
C62_SQL_TERMINALS
Supercluster D
The grammar of keys and the austerity of terminals showed how deeply representation shaped practice. Tables imposed structure, queries defined access, and the screen turned abstraction into routine. These foundations fixed the habits of data work even as new interfaces evolved on top of them.
***
The relational model gave data a shared form of expression. From Codd’s rules to SQL’s syntax, it provided a language that institutions could standardize on and vendors could build around.
The Object-Oriented Model — Languages, Databases, and Interfaces
Relational databases gave data a universal form, but they remained abstractions of structure — snapshots of state rather than living models. As computing moved into simulation, design, and interactive media, new representational needs appeared.
The answer was the object: a construct that carried both data and the methods that shaped it. Objects could inherit traits, respond to messages, and be organized into families, making software resemble a network of interacting entities. What began in simulation and graphical systems expanded into programming languages, experimental databases, and eventually the interfaces where users encountered digital objects on screen.
D1
Modeling the World: The Rise of Object Orientation
The first steps toward object orientation came from attempts to model dynamic systems. In Norway, simulation research sought ways to describe interactions unfolding over time. In the United States, graphical experiments explored how visual elements might carry structure and rules.
These early efforts did not yet define a dominant paradigm, but they introduced a new representational logic: information could be expressed as entities with roles and relationships, rather than as static entries in a table.
D10_SIMULA_OOP
Simula and the Invention of OOP
Computer studies in Norway began in the 1950s within military research. Physicist Jan V. Garwick introduced digital methods at the national Defense Research Establishment, where Ole-Johan Dahl and Kristen Nygaard later collaborated on modeling complex systems such as bank queues and shared resources.
Collaboration with Manchester delivered Norway’s first Mercury computer in 1957, and by the early 1960s the Norwegian Computing Center in Oslo became a hub for their work.
Oslo Town Hall (1956). Ole-Johan Dahl first attended NDRE computing sessions here, where Norway’s defense establishment introduced digital methods to researchers. Source: DigitaltMuseum
Their language, Simula I (1965) and its successor Simula 67, introduced the concept of objects: program units with identity, data, and behavior. Conceived as tools for simulation, they established principles that would shape later programming.
Ole-Johan Dahl and Kristen Nygaard. Their collaboration at the Norwegian Computing Center produced Simula I and Simula 67, the first object-oriented languages. Source: History-Computer
Computer scientist Georg Philippot, recalling his time teaching Simula on a CDC 3300, described ending a course with a program that played Chopin’s funeral march as the machine was retired — a symbolic farewell to early computation and the beginning of a new paradigm.
CDC 3300 terminal at the computing center in Berlin. Machines like this hosted Simula courses. Source
D10_SIMULA_OOP
D11_OOP_DEFINITION
What Simula introduced was a programming trick with a new representational logic. By allowing entities in code to mirror actors in the world, it shifted software closer to modeling lived systems. And the concept of objects became a way to represent complexity without breaking it apart.
D11_OOP_DEFINITION
What Is Object-Oriented Programming?
Object-oriented programming (OOP) structures software around objects — units that combine data (attributes) with behavior (methods). Each object belongs to a class, which defines its properties and capabilities.
Classes can inherit traits from other classes, allowing shared logic while supporting specialization. A “Vehicle” class, for example, can define rules common to all transport, while “Car” and “Bike” extend it with their own features.
The Simula logo, created in Oslo during the 1960s. Simula introduced the concept of objects and became the first object-oriented programming language. Source
Objects interact by sending messages that invoke behavior, making systems evolve through encapsulation and modular design. Originally built for simulation, OOP soon became a general programming paradigm. It underpins most modern software design, from operating systems and business platforms to mobile apps and video games.
D11_OOP_DEFINITION
D12_SKETCHPAD_OBJECTS
Instead of treating code as a sequence of steps, the object model gave programmers a way to represent whole systems as networks of roles and categories. This was more than a programming convenience: it was a symbolic framework that aligned digital description with human habits of classification and analogy.
D12_SKETCHPAD_OBJECTS

Sketchpad — The Birth of Interactive Objects
In 1963, Ivan Sutherland’s Sketchpad redefined how humans could work with machines. Built for the TX-2 mainframe at MIT’s Lincoln Lab, it let users draw directly on a screen with a light pen and then duplicate, constrain, or link elements.
Each element behaved like a reusable template, carrying constraints and relationships that could be inherited across instances. Without using the term, Sutherland had created a graphical environment where entities had identity, structure, and hierarchy.
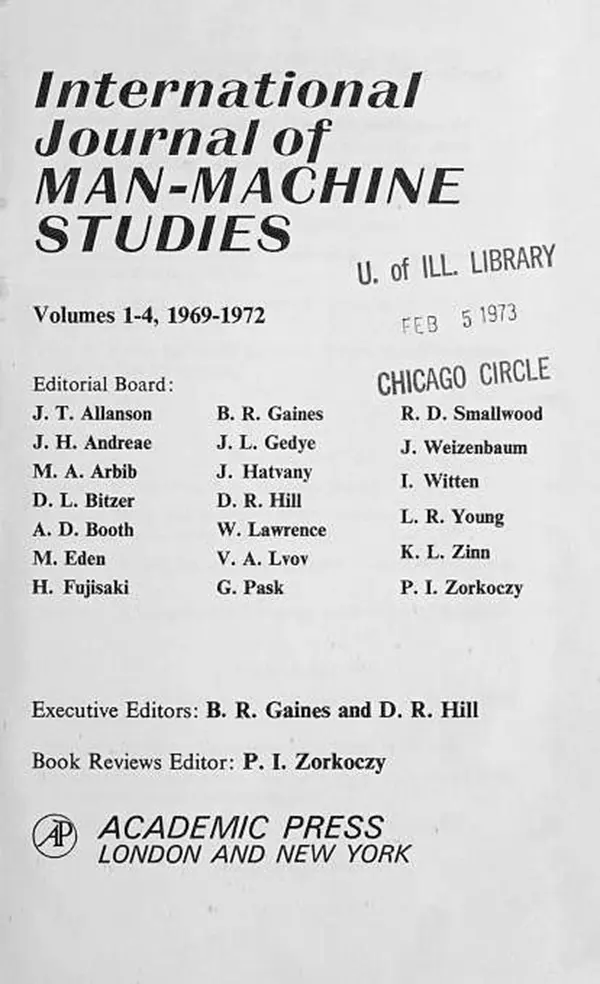
Early research in interface design and cognition. Journals such as the International Journal of Man-Machine Studies built on concepts pioneered by Sketchpad, showing how its ideas influenced both technical design and the emerging study of human–computer interaction. Archive.org
Sketchpad became a foundation for computer-aided design, graphical user interfaces, and later object-oriented languages. It demonstrated that digital systems could respond in real time to visual input, shifting programming toward environments built from objects that could be manipulated directly.
Video demonstration of Sketchpad (1963). Ivan Sutherland shows the system running on the TX-2 computer at MIT’s Lincoln Lab, where users could draw with a light pen and manipulate objects directly on screen.
D12_SKETCHPAD_OBJECTS
D13_SMALLTALK_JAVA
Sketchpad redefined what it meant to represent information in a digital system. It showed that drawings on a screen could stand as structured models, not just visual output. By treating visual marks as entities that embodied relationships, it blurred the line between diagram and data. Representation was no longer limited to symbols in code — it could appear directly as forms, patterns, and spatial structures that carried meaning in themselves.
D13_SMALLTALK_JAVA
Smalltalk to Java — Language Evolution
At Xerox PARC in the early 1970s, Alan Kay and his team drew on Simula, Sketchpad, and LISP to design Smalltalk — a system where everything was an object, from numbers to windows. It introduced dynamic class creation, inheritance, and a live graphical interface, offering an integrated environment rather than a standalone language.
Alan Kay at PARC. His background in music shaped his vision of software as modular, interactive, and improvisational — ideas that guided the creation of Smalltalk in the 1970s. Source: CyborgAnthropology
Cover of Smalltalk-80: The Language (1989) by Adele Goldberg. As part of the Xerox PARC team, she co-developed Smalltalk and advanced key object-oriented concepts that later influenced mainstream programming. Source: Amazon
While commercially limited, Smalltalk’s ideas shaped the next generation of programming. In the 1980s, C++ extended the C language with classes, bringing object orientation into mainstream engineering. By the 1990s, Java simplified object-based design for the web era, and Microsoft’s C# followed with a hybrid model for enterprise software.
D13_SMALLTALK_JAVA
Cluster D2
Object orientation offered a new way to represent systems. Instead of separating logic from data, it unified them as objects that could stand for entities in the world. This gave programming a descriptive power closer to diagrams and categories than to lists of instructions. It was a shift in how knowledge itself could be expressed in code — a representational model that bridged simulation, graphics, and language design.
D2
Object-Oriented Data Systems — Promise and Limits
By the 1980s, the object model had become a reference point for describing structure in software. The next challenge was storage. Relational databases worked well for tables and rules, yet they fragmented the nested forms and evolving versions that objects described in memory.
Object-oriented databases emerged as an attempt to resolve this tension. They aimed to record whole entities — complete with identity and relationships — so that data could preserve the same integrity on disk as in code.
D21_OODBMS_ARCHITECTURE
Building OODBMS — Architecture and Challenges
As applications grew more complex — in areas such as computer-aided design, multimedia, and geographic information systems — relational databases revealed their limits. Flat tables and joins could not easily handle nested structures, versioning, or user-defined behaviors.
The solution proposed in the mid-1980s was the object-oriented database management system (OODBMS). In these systems, data entries were full objects with identity, structure, and behavior, often linked in complex hierarchies. Methods as well as attributes could persist, narrowing the gap between code and storage.
Early projects such as GemStone (built on Smalltalk) and Orion (written in Common Lisp) attempted this fusion of programming environments with persistent storage. They illustrated both the appeal and the difficulty of merging two paradigms that had evolved separately.
Interface from GemStone/S 2.5. This object-oriented database merged Smalltalk’s class structures with persistent storage, demonstrating how OOP principles were applied to data management. Source: The GemStone Object Database Management System, p. 68
D21_OODBMS_ARCHITECTURE
D22_OODBMS_APPLICATIONS
Object-oriented databases feel less like storage engines and more like descriptive frameworks, preserving complexity, volume, and dynamics right inside the model.
D22_OODBMS_APPLICATIONS

CAD, Multimedia, and the Object-Oriented Edge
Object-oriented databases found their strongest applications in domains that required complex representations. Computer-aided design (CAD) relied on nested hierarchies of parts, layered graphics, and evolving versions — all difficult to capture in relational tables.
Multimedia systems demanded ways to unify images, video, and sound under shared structures. Geographic information systems (GIS) layered spatial and temporal data into interlinked objects.
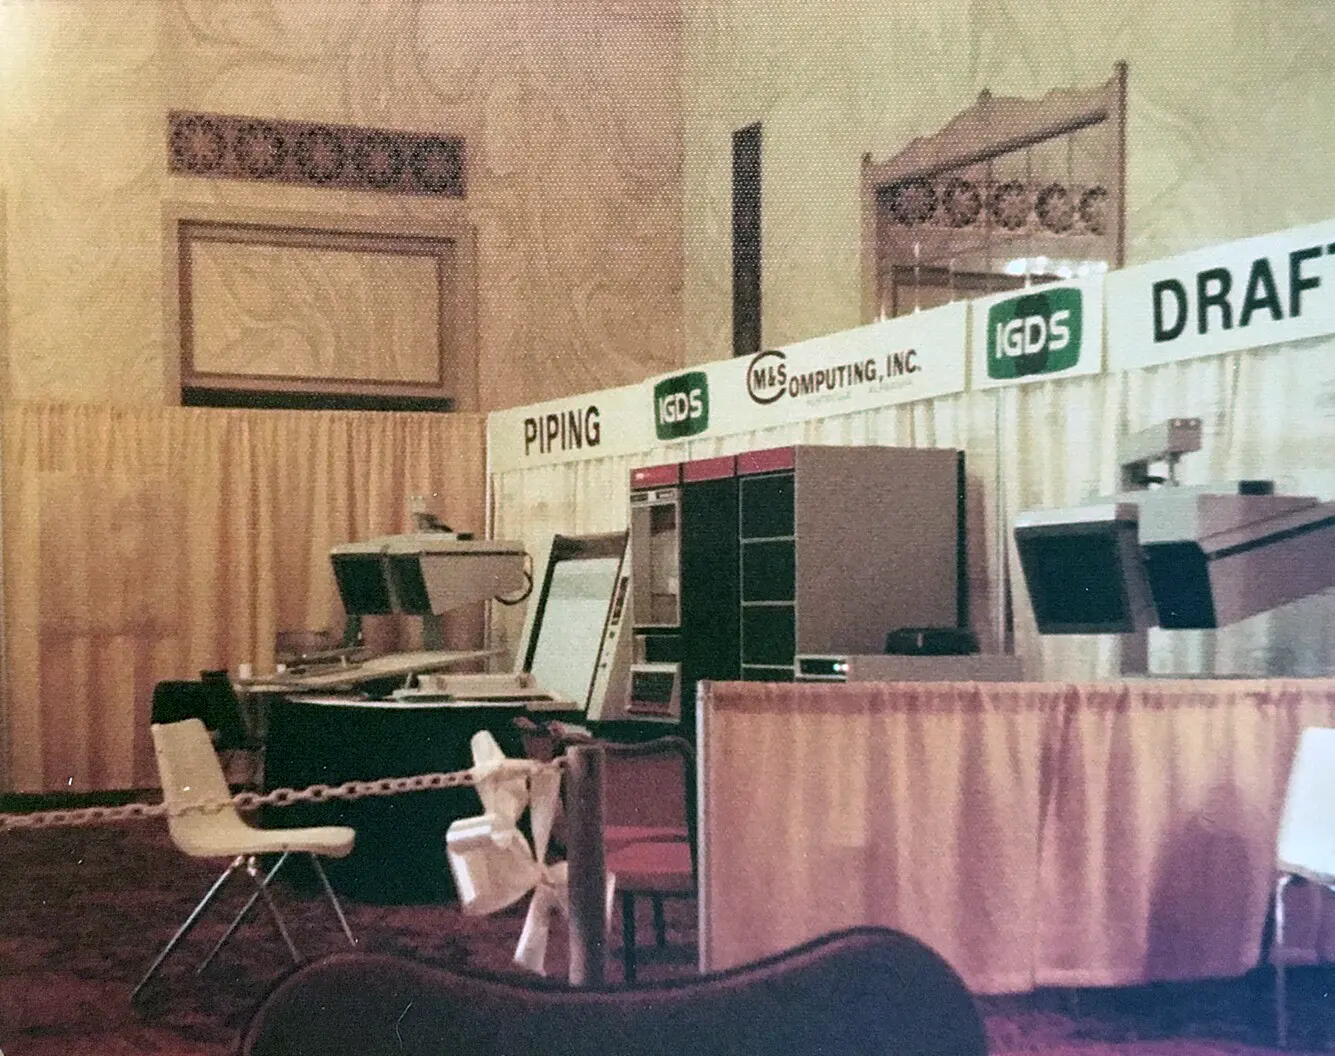
M&S Computing (later Intergraph) demonstrating CAD tools (1978). Early CAD required models with nested parts and evolving versions — pressures that encouraged the adoption of object-oriented databases for representing complex structures. Source
Projects such as STORM, developed at the University of Wisconsin, and Jasmine, a Japanese research initiative, demonstrated media-aware queries that could traverse formats and timelines. Teradata GIS and related efforts applied object-oriented logic to mapping and infrastructure, letting analysts represent geography as linked entities rather than disconnected records.
D22_OODBMS_APPLICATIONS
D23_OODBMS_FAILURE_HERITAGE
These applications showed the representational ambition of object-oriented databases. They sought to keep data aligned with the way people already conceived it — as designs with parts, media with layers, or maps with linked places and times. Objects turned storage into a model of thought itself, preserving relationships dynamics that would otherwise be broken apart by tables.
D23_OODBMS_FAILURE_HERITAGE
From Promise to Postmortem — The Rise and Fall of OODBMS
Object-oriented databases promised to eliminate the “impedance mismatch” between code and storage. By treating data entries as objects, they seemed to offer a natural fit for CAD, multimedia, and simulation systems that demanded complex hierarchies and evolving relationships.
CAD design of a Stihl chainsaw (1980s). Applications like CAD demanded hierarchies and versioning that relational systems struggled to handle. Source: Finnish Forest Museum Lusto; Metsähallituksen collection.
Readings in Object-Oriented Database Systems (1990), edited by Zdonik and Maier. This collection captured the momentum of OODBMS research — and the fragmentation that limited its adoption. Source: Google Books
Yet commercial adoption in the 1980s-90s faltered. Each platform tied objects to specific programming languages, and without a common query language like SQL, systems could not work well together. Schema changes were fragile, administrative tools were underdeveloped, and relational vendors kept improving performance and reliability, widening the gap.
Though most OODBMS products faded, their ideas persisted. Object-relational mapping frameworks like Hibernate and ActiveRecord reintroduced the concept at the application layer, while NoSQL systems such as MongoDB revived nested structures and flexible schemas. Even modern SQL engines now support complex types and JSON, echoing features pioneered by OODBMS.
Representation Now — The Modern Shapes of Data
The attempt to store objects intact revealed the limits of representational fidelity. Databases could mirror the forms engineers and designers worked with, but the costs of standardization and scale were too high. What survived was not the systems themselves but the idea: that data should be kept in structures resembling the entities it stands for.
***
From tables to objects to hybrid models, the history of representation in computing has been a search for forms that hold meaning without distortion — another turn in the long project of rationalizing the world through its images. It began with marks clear only to the author, and ended with representations designed for anyone to read — a paradoxical simplification of complexity itself.
Interfaces are where humans and data meet. They are the formats, rituals, and devices that make information usable — from mechanical dials to forms, diagrams, and imagined machines. Unlike raw representation, which arranges information, interfaces emphasize interaction: they determine who can access data, how it is read, and what actions it enables.
Across history, interfaces have taken many shapes. A parish register could turn fluid identities into fixed fields; a punched card could reduce a worker’s life to a set of holes; a visionary desk-machine could promise personal trails through knowledge. Each interface defined a boundary between people and information, shaping both in the process.
Seen in sequence, these encounters reveal how data has always required mediation. Interfaces do not just deliver facts — they condition perception, constrain choices, and suggest futures.
The Pre-History of Programmable Hardware
A01_AUTOMATA_CONTROL
Early Automation — Temple Miracles [Tower Clocks] and Music Boxes
Before punch cards and programmable computation, humans engineered astonishing mechanical systems to represent, control, and display data. These devices served as precursors to modern information technologies, blending automation with symbolic function.
Heron’s automation project for a statue of Bacchus pouring wine and milk in a temple. Illustration in a 13th century manuscript. Source
A self-trimming lamp, from the book “On Mechanical Devices” by Ahmad ibn Mūsā ibn Shākir (9th century CE). Source: Staats Bibliothek Berlin
Strasbourg astronomical clock (1574), a civic monument of timekeeping and automata. Source
Van Eyck and the Hemony brothers working on the carillon. Lithograph by W. G. Hofdijk (c. 1875), from “Lauwerbladen uit Neerlands Gloriekrans. Source
Claude Monet, “The Zuiderkerk, Amsterdam” (c. 1874). Philadelphia Museum of Art. The Zuiderkerk tower (1656) was among the earliest to house a fully automated Hemony carillon — a direct antecedent to punched media. Source
One of the earliest documented examples is Heron of Alexandria’s 1st-century CE automata: programmable theater devices, coin-operated dispensers, and wind-powered machines. These relied on systems of ropes, gears, and counterweights — physical logic encoded in motion. They demonstrated that information could be embedded in a mechanism, with repeatable outputs triggered by controlled inputs.
By the late Middle Ages and early modern period, public clocks and automata took on increasingly representational functions. The Strasbourg astronomical clock, for instance, combined religious calendar tracking with celestial mechanics, animating saints, angels, and planetary positions. These weren't mere decorations — they automated civic rituals and encoded cosmic models for public audiences.
In the 17th century, the Hemony brothers pioneered pinned-cylinder bell carillons in Amsterdam, prefiguring later musical machines and punch card systems. Their programmable melodies translated sound into hardware logic — a principle reused in music boxes, player pianos, and eventually looms and computers.
A01_AUTOMATA_CONTROL
A12_BABBAGE_LOVELACE_PUNCH
Before databases and screens, the first interfaces were mechanical spectacles. Automata and monumental clocks translated cosmic cycles or sacred rituals into motions that anyone could witness. These devices mediated between hidden data flows and human observers, turning data into something legible through sight, sound, and rhythm.
A12_BABBAGE_LOVELACE_PUNCH

Symbolic Input — Babbage and Lovelace
Charles Babbage, a mathematician and inventor, designed two groundbreaking machines — the Difference Engine and later the Analytical Engine, the first serious attempt at general-purpose computation. Conceived in the 1830s–1840s, the Analytical Engine introduced ideas far ahead of its time: an arithmetic unit, memory registers, control flow with loops and conditionals, and a programmable instruction set using punched cards.
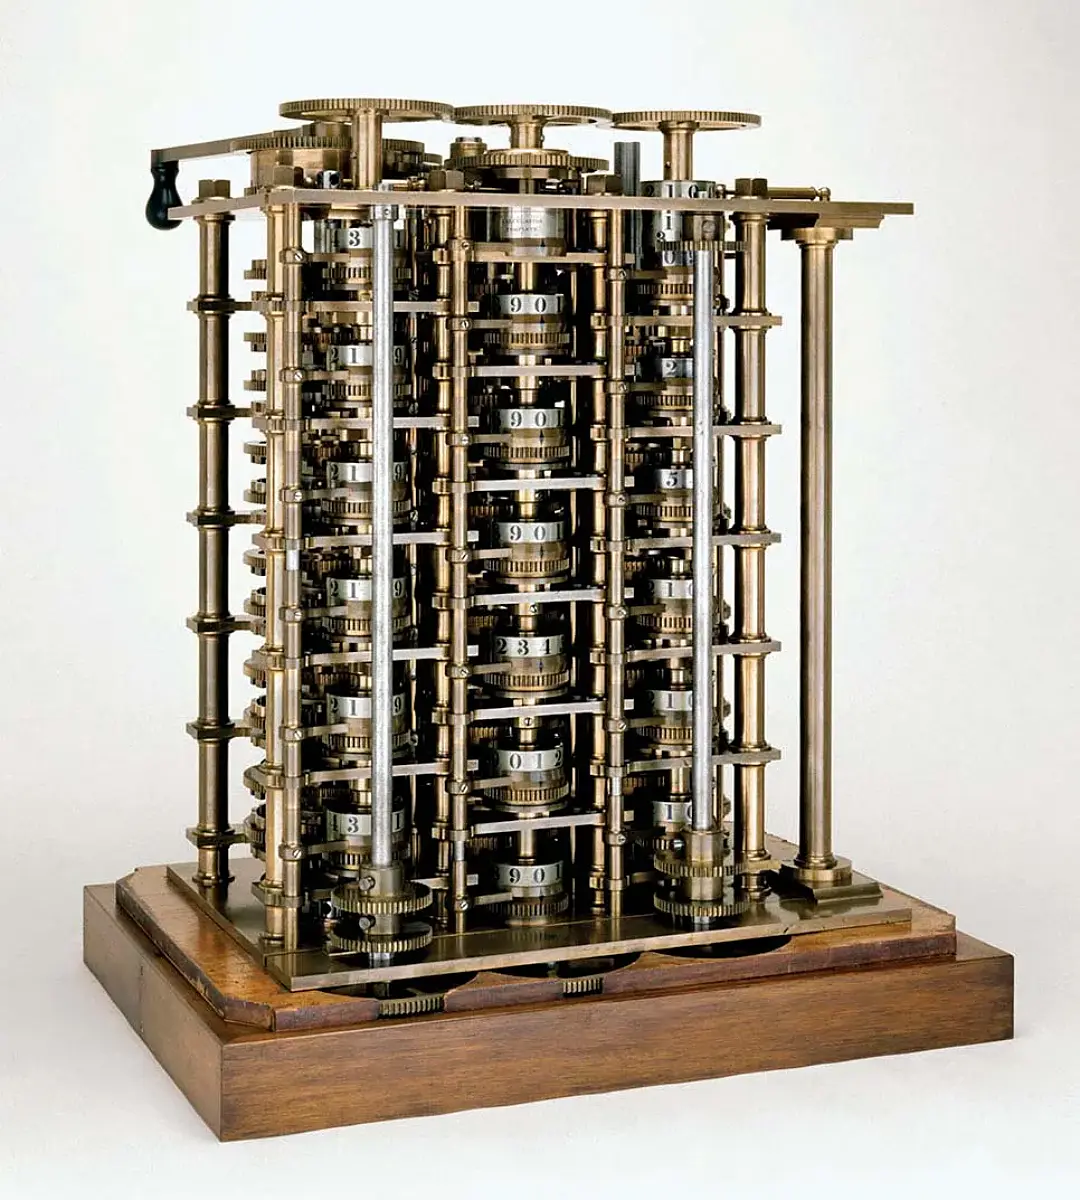
Babbage’s Difference Engine, on display at the Science Museum, London. Only partially built in his lifetime, it demonstrated the feasibility of complex mechanical computation. Source: Science Museum
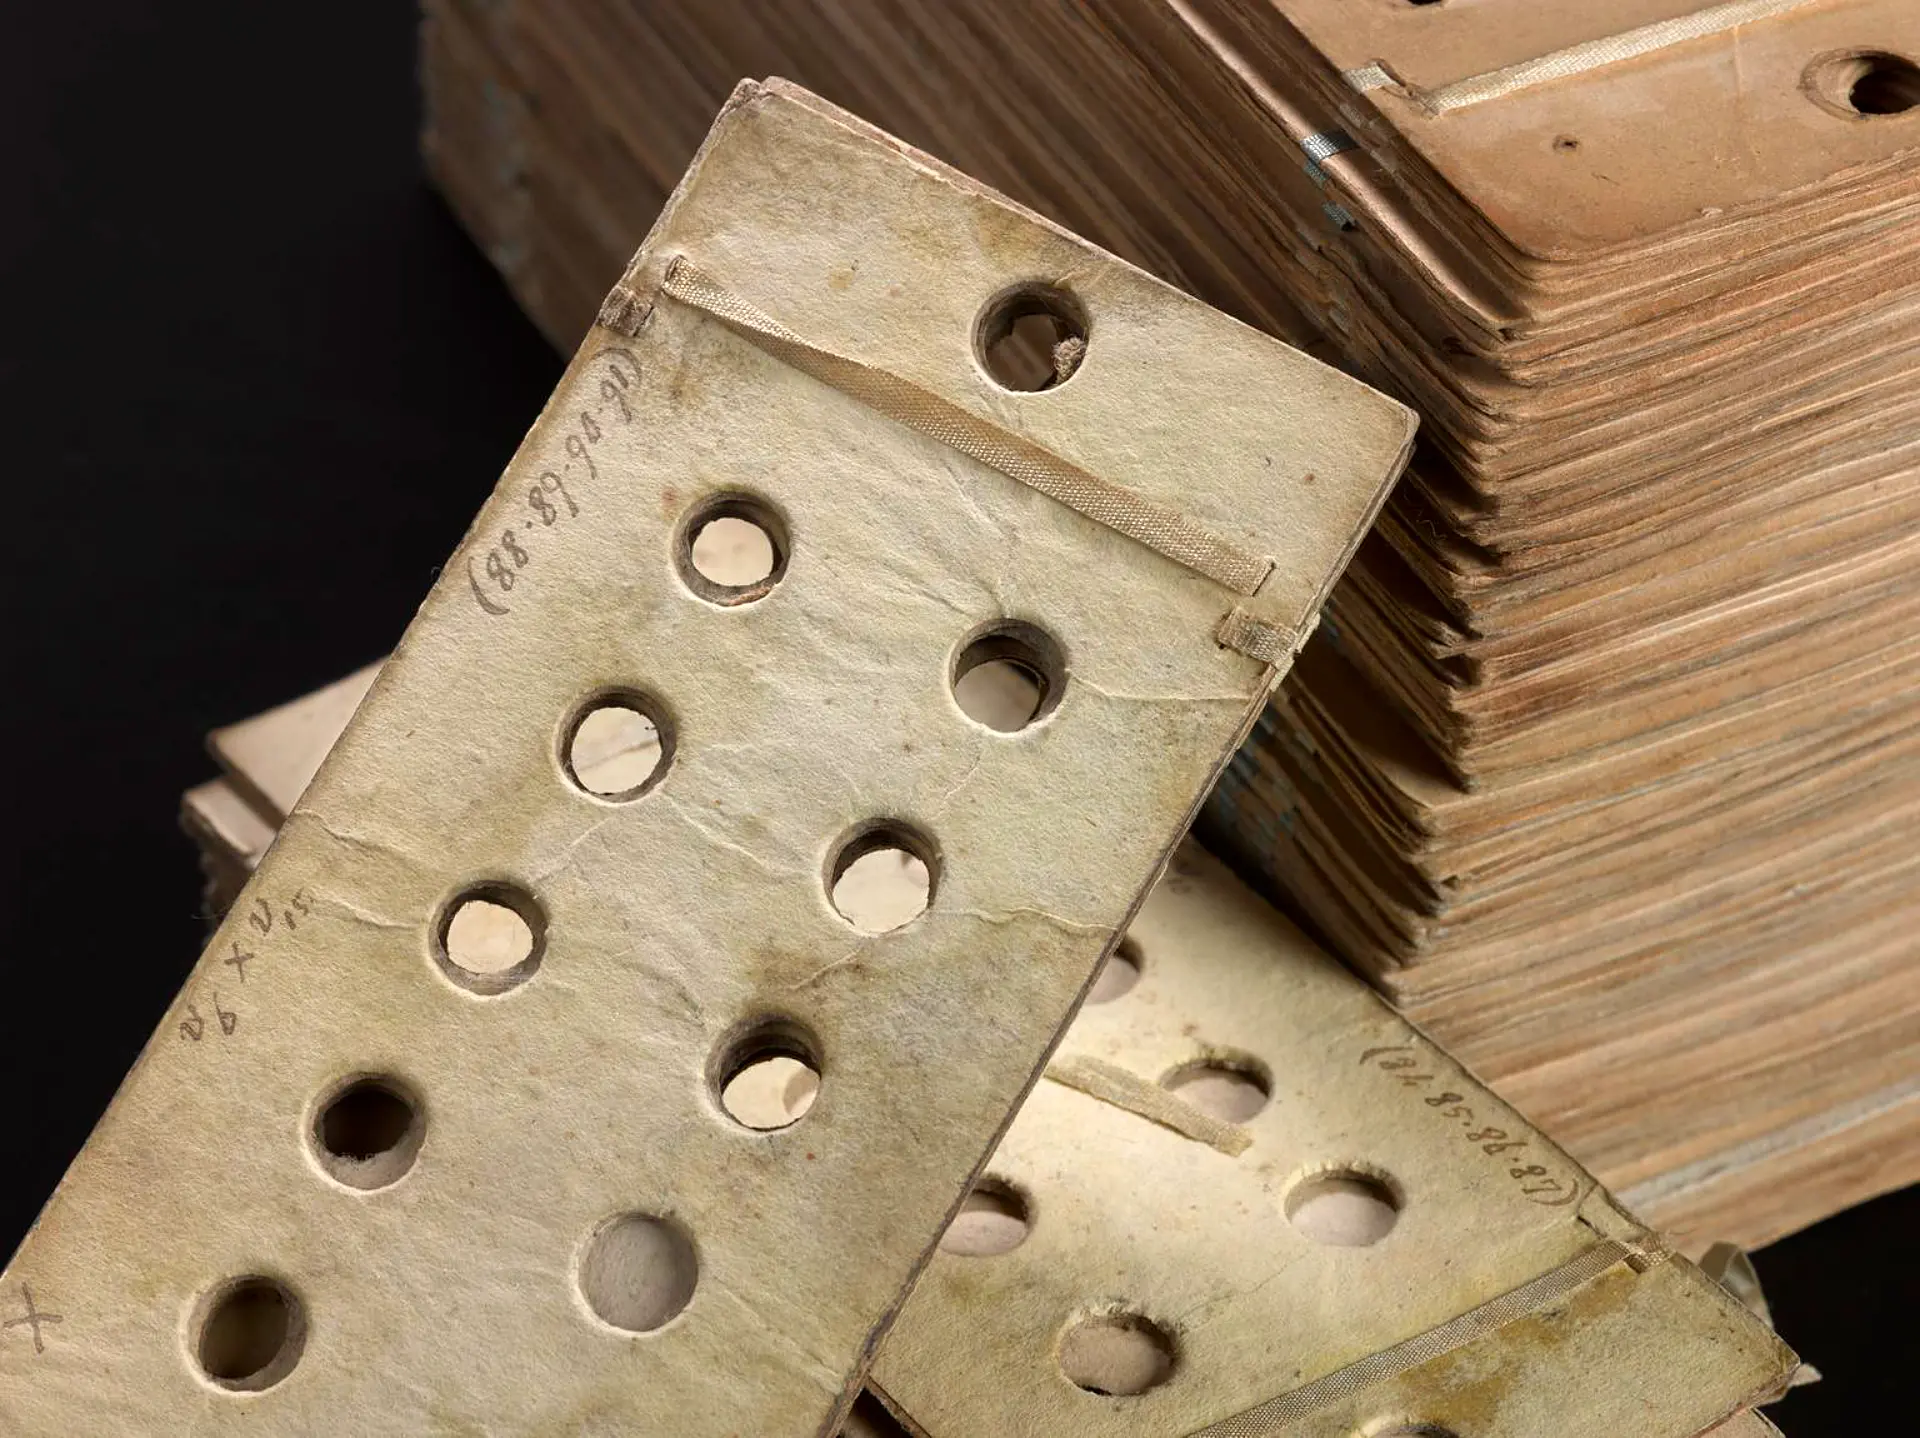
Two types of punched cards for Babbage’s Analytical Engine — operation cards (specifying instructions) and variable cards (specifying data), adapting the Jacquard method for programmable logic. Source: Science Museum
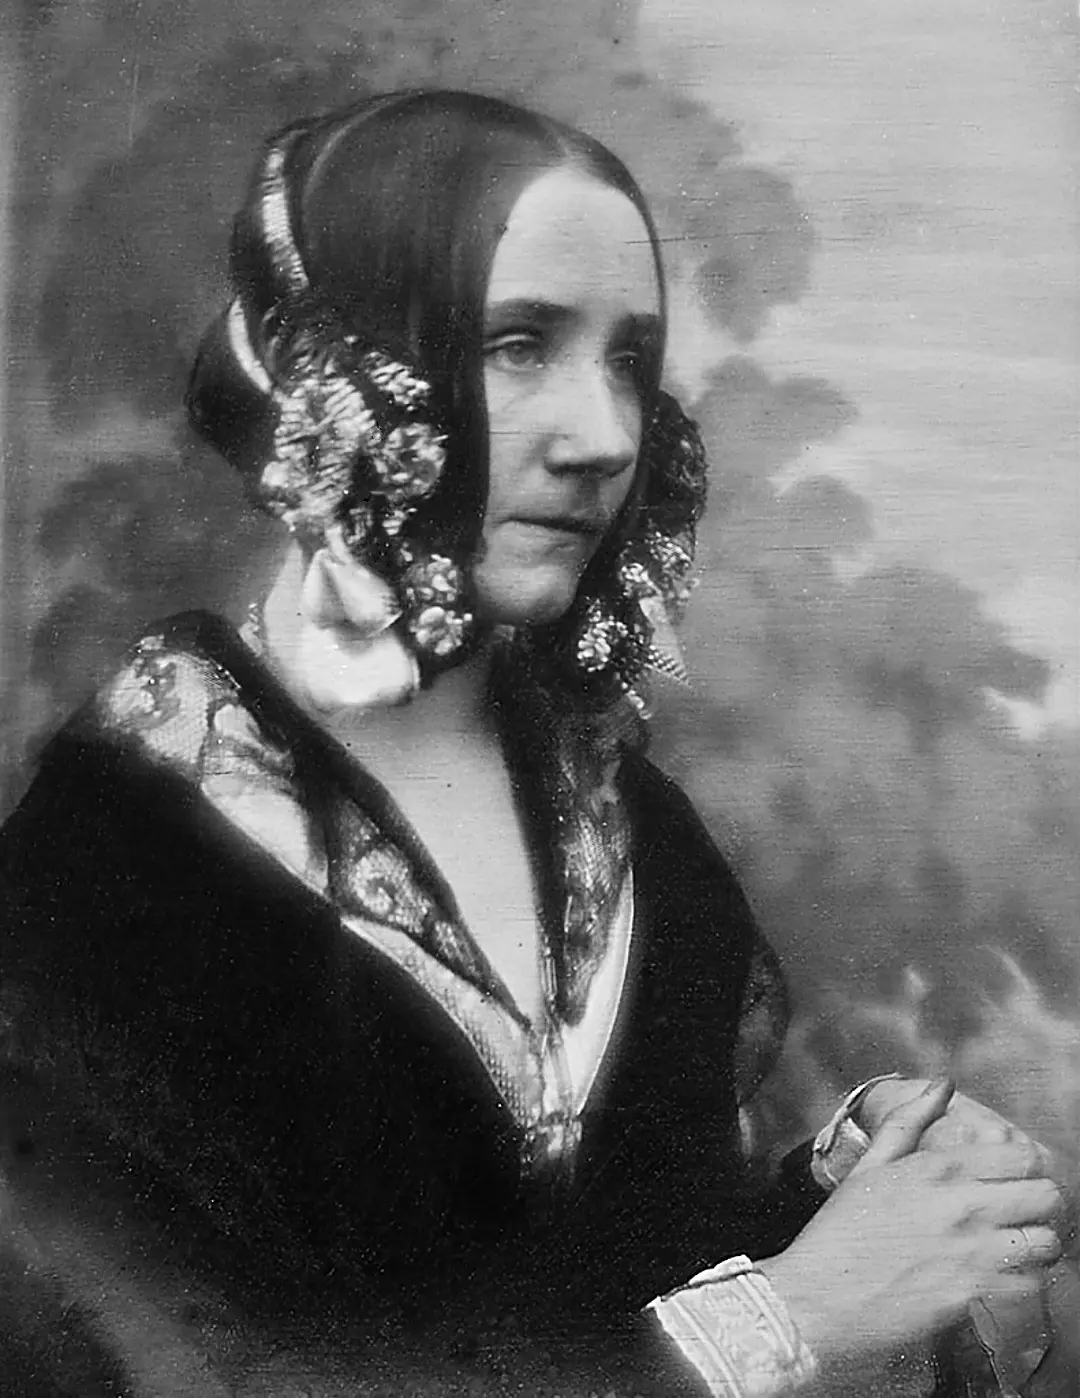
Portrait of Ada Lovelace by Antoine Claudet (c. 1843). Lovelace wrote the first published algorithm for a machine and foresaw the wider potential of computation beyond numbers. Source
Babbage borrowed the concept of card-based control directly from the Jacquard loom, which encoded textile patterns as holes in cardboard. But instead of patterns for thread, Babbage imagined instructions for mathematical operations. His machine was never completed, but the architecture he proposed resembles many features found in modern CPUs and programming languages.
Ada Lovelace, working with Babbage in the 1840s, famously grasped the deeper implications of the machine. She proposed that the Engine could manipulate symbols as well as numbers, and might one day compose music or graphics — not merely calculate. Her notes are now recognized as the first published computer program.
A2
Rationalizing the World: Data, Design, and the Logic of Representation
Interfaces are never neutral. By the 17th and 18th centuries, rulers and reformers had begun to imagine entire societies as datasets — populations, trades, and lands organized into grids. The interface here was the template itself: the categories, fields, and abstractions that made reality legible, while also prescribing how it could be acted upon.
A21_EARLY_STATISTICS
Counting to Govern — Political Arithmetic and Early Statistics
Long before mechanical tabulators, governments used data to exert control. In early modern Europe, the rise of absolutist states brought new pressures to measure, compare, and forecast populations. Inspired by older registers like the Domesday Book, a new intellectual tradition emerged in the 17th century: political arithmetic.
Title page of Johannes Weitzel’s “Geschichte der Staatswissenschaft” (early 19th century), reflecting the formalization of state science as an academic and administrative discipline in German-speaking regions. Source
William Petty (1623–1687), pioneer of political arithmetic. His demographic and economic analyses laid foundations for modern statistical governance. Source
Table from the Down Survey (1655–1656), an early large-scale land and property data collection in Ireland under William Petty, using tabular methods to inform colonial administration. Source
Folio from the Domesday Book (1086), detailing Warwickshire. Part of William the Conqueror’s survey of English landholdings, one of Europe’s earliest centralized census efforts. Open Domesday
Pieter Bruegel the Elder, “The Census at Bethlehem” (1566), a Flemish reinterpretation of the biblical census that blends daily life with state authority in early modern administrative culture. Source
Pioneers like John Graunt and William Petty introduced statistical summaries of mortality and trade in London, proposing that societies could be studied mathematically. In German-speaking states, this formalized into Staatswissenschaft — the “science of the state” — combining demographic counts, land surveys, and resource assessments into a toolkit for rational administration
A21_EARLY_STATISTICS
A22_ECON_GRAPHICS
Political arithmetic turned governance into a matter of numbers, but the interface remained largely textual: reports, lists, and summaries. The challenge ahead was to find ways of seeing relationships that prose could not capture. Economists and engineers began to draw curves and diagrams, interfaces that promised to reveal patterns hidden behind columns of figures.
A22_ECON_GRAPHICS
Visualizing Economies — From Verbal Reasoning to Graphical Models
Throughout the 19th century, the integration of mathematical methods into economics began to reshape data interpretation, despite resistance from traditional theorists. Many early modelers — including engineers like Charles Ellet and Jules Dupuit — introduced diagrams and curves to represent trade, cost, and flow.
Henry Higgs, “Some Remarks on Consumption,” in the Economic Journal (December 1899). Illustrates how qualitative analysis and verbal reasoning still dominated economic theory at the turn of the century, while mathematical modeling remained rare. JSTOR
Alfred Marshall’s graphical models (1870s–1890s), p. 67. Early use of curves to represent economic forces such as supply and demand, helping to formalize economics as a mathematical science. EE-T Portal
Their attempts to visualize economic behavior were seen as marginal at first. As late as 1892, 95% of articles in the top four economics journals used neither mathematical notation nor graphs (Stigler and Friedland, The Journals of Economics).
Still, this shift was underway. By the 1870s, Alfred Marshall brought graphical modeling into the mainstream, using intersecting curves to depict market mechanisms. These visualizations made abstract theory accessible and policy-relevant — a foundational turn toward data-driven economic reasoning.
A22_ECON_GRAPHICS
A23_JACQUARD_PROGRAMMING
Graphs and curves introduced a new interface for economic thought — one where forces could be pictured and compared without words. Supply and demand appeared as lines crossing on a page, turning theory into something that could be seen. This act of drawing made abstract dynamics legible as if they were objects, inviting readers to interact with ideas through vision rather than prose.
A23_JACQUARD_PROGRAMMING
From Rule-Paper to Punch — Designing with Cards Before Computers
The Jacquard loom created a radically new workflow of design abstraction. The key step was the mise en carte: transposing a textile pattern into an enlarged grid (rule-paper), where each square represented a thread action. From this intermediate visualization, specialized workers could generate punched cards — the program — detached from the weaver and readable by the machine.
Jacquard engine attached to a carpet loom (c. 1840). From Toshio Kasamitsu’s doctoral dissertation, 1982, p. 52. Source
In 1835, French machine maker C. Guillotte described this logic-to-fabric pipeline before a British committee. His testimony revealed an early encounter with the formalization of instructions. Design was now “read in,” parsed into discrete mechanical steps, and stored in physical memory.
This early modularization of creative labor—design, translation, encoding—foreshadowed modern digital interfaces and data visualization. Long before computers, workers were debugging logic patterns and offloading execution to automated systems, mediated through symbolic encodings on physical media.
A24_INSTITUTIONAL_CARDS
Cluster A3
Besides being a technical step in weaving, the mise en carte was a new kind of interface between imagination and execution. A textile design moved through grids on paper, into punched cards, and finally into fabric. Each stage translated intention into a new symbolic form, separating the act of creation from the act of performance. The loom thus offered one of the earliest examples of a mediated workflow, where design could be stored, circulated, and read by machines as well as people.
A3
Enumerating the World: Counting as Ritual, Power, and Abstraction
Interfaces of enumeration reached back to the earliest states. Lists, tallies, and rolls did more than capture numbers — they staged authority. A census tablet, a parish register, or a colonial form was never just a record: it was a template that structured encounters between people and institutions. Enumeration became an interface in its own right, fixing identities and obligations in lines and boxes, and teaching subjects how they could be seen.
A31_EARLY_ENUMERATION
Sacred Numbers and Civic Counts — Early Enumeration as Control and Ritual
Long before modern statistics, societies developed elaborate systems for counting people, goods, and time.
Cuneiform tablet (Sumer, c. 3000 BCE), used to record grain and livestock quantities as part of temple administration. Such artifacts enabled resource tracking, labor management, and redistribution across Mesopotamian city-states. Musée du Louvre, AO 29560. © 2002 GrandPalaisRmn (Musée du Louvre) / Franck Raux. Louvre
Clay tokens and bullae (Sumer, pre-3000 BCE), used as transaction records. Small tokens representing goods such as grain or sheep were sealed in hollow clay envelopes. This system provided the conceptual groundwork for abstract numeration and the invention of writing. Musée du Louvre, Iran antique 17403. Source
Model of cattle census (Egypt, 11th Dynasty). Wooden funerary model from the tomb of Meketre, showing scribes counting livestock. Such scenes were both documentary and magical, intended to ensure the eternal continuation of bureaucratic order and provisioning in the afterlife. Egyptian Museum, Cairo. Source.
Han Dynasty administrative slips (China, c. 1st century CE). Strips of bamboo and wood bound into scrolls, used to record census figures, tax receipts, legal proceedings, and edicts. Though paper existed, these durable media defined early Chinese record-keeping at imperial scale. Ejine Banner Museum of Inner Mongolia. China Services Info
Roman military diploma (90 CE), cast in bronze. Granted citizenship and marriage rights to a discharged auxiliary soldier. Designed for durability and authenticity, such diplomas reflect Rome’s infrastructure for legal and identity verification across the empire. Israel Museum. Source
Census of Quirinius, mosaic (Istanbul, c. 14th century), Church of the Holy Saviour in Chora. Depicts the biblical census from the Gospel of Luke, enshrining Rome’s enumeration practices in religious memory. The scene links identity, taxation, and power, showing census as both ritual and registration. Source
In ancient Sumer, clay tokens evolved into cuneiform tablets to track grain, livestock, and labor — a direct response to the needs of temple economies. Egypt’s annual nilometer readings and population tallies shaped everything from taxation to cosmic order. In Imperial China, the household registration system (hukou) maintained dynastic stability. Rome’s census did more than record — it legitimized class, military duty, and political privilege.
A31_EARLY_ENUMERATION
A33_ENUMERATION
Counting as ritual revealed the interface between cosmic order and civic rule. A tally of grain or soldiers was also a negotiation with gods, kings, and ancestors — the numbers bound to larger systems of meaning. These acts turned record-keeping into ceremony, showing how enumeration worked as a performance of legitimacy, carried out in the presence of power.
A33_ENUMERATION
Enumeration and Meaning — From Lists to Categories
Enumeration isn't just about counting — it's about how categories get visualized and fixed. In the 17th and 18th centuries, European administrations relied on increasingly tabular formats: not simply ledgers of names and taxes, but forms that pre-structured reality into discrete fields, rows, and groupings.
Parish register page (England, 17th–18th c.), with neatly ruled columns for baptisms, marriages, and burials. By reducing lived events to standardized entries, these registers transformed experience into categories. North Yorkshire Archive Blog
André-Michel Guerry’s “Instruction” map of France (1833), showing literacy rates by département with color shading. The map enforced classification and comparison within spatial and categorical constraints. ResearchGate
These documents forced complexity into grids. “Head of household,” “acreage owned,” “occupation,” or “tribe” became checkboxes. In colonies and empires, local identities were reshaped into legible categories that fit bureaucratic templates — erasing nuance in favor of scale and control.
This transition marked a foundational step toward modern data representation.
A33_ENUMERATION
Cluster A4
Once categories were formalized, the interface shifted from ritual to administration. A name, an occupation, or a tax became a field to be filled, standard across thousands of documents. The very act of writing into these boxes taught subjects how to understand themselves within the system: as entries in a register, positioned among others, comparable and sortable.
A4
Business Data and Tabulation
As commerce expanded, businesses developed their own interfaces for handling data. Beyond state registers or scholarly tables, firms needed tools that could align daily operations with profit and risk.
From illustrated manuals to motion studies and records punched into cards, these practices built a language of interaction between managers and information. Business data did not stay in the background — it was formatted to be acted upon, turning interfaces into instruments of decision.
A41_SCI_ILLUSTRATION
Image and Argument — Scientific Illustration as Data Practice
Before numerical models dominated, knowledge was often conveyed through images. Scientific illustrations meant more than decoration — they were essential tools for observation, measurement, and communication. In the Renaissance, artists like Brunelleschi and Piero della Francesca systematized linear perspective, providing a new framework for visual reasoning.
Geometrical drawing of an icosahedron inside a cube by Piero della Francesca, from “De quinque corporibus regularibus” (c. 1460). This study shaped post-Medieval fine arts and influenced the early development of data visualization techniques. Source
Geometrical drawing of an icosahedron inside a cube by Piero della Francesca, from “De quinque corporibus regularibus” (c. 1460). This study shaped post-Medieval fine arts and influenced the early development of data visualization techniques. Source
“Melencolia I,” engraving by Albrecht Dürer (1514). Source: Metropolitan Museum
In the late 15th century, printed science texts such as Euclid's Elements (Erhard Ratdolt, 1482) integrated geometrical diagrams alongside mathematical logic, shaping how abstract concepts were understood. Johannes de Sacrobosco's astronomical works used diagrams to explain celestial mechanics, providing a visual means of understanding complex, invisible systems.
By the 16th century, Albrecht Dürer combined anatomical precision with proportional geometry, exemplified in his Four Books on Human Proportions. These illustrations went beyond artistic representation, offering a form of visual argumentation that influenced both scientific reasoning.
A41_SCI_ILLUSTRATION
A42_BUSINESS_INTELLIGENCE
Illustrations made abstract knowledge visible, but they also trained readers to treat images as interfaces: diagrams to be measured, compared, and reasoned with. From perspective studies to anatomical drawings, these images suggested that information could be manipulated through sight alone. They pointed the way toward later graphics where data itself, not just concepts, would be pictured as a form of argument.
A42_BUSINESS_INTELLIGENCE
Early Business Intelligence — From Intuition to Data
Sir Henry Furnese, who founded the Bank of England in 1694, was among the first merchants to build espionage networks, gathering reports from across Europe on military, political, and trade affairs. His ability to anticipate market shifts through such information marked an early form of business intelligence, moving commerce from instinctual decision-making toward data-driven speculation.
Adriaen van Diest, “Destruction of the Soleil Royal at the Battle of La Hogue” (1692). This pivotal event in the Nine Years’ War shaped European political and military outcomes and influenced emerging financial systems. The Bank of England, mentioned earlier, was founded to fund this conflict. Source: Royal Museum Greenwich
With the rise of industrial capitalism, businessmen sought more formalized, empirical ways to manage complexity. In the 1880s, engineer Frederick Winslow Taylor developed time-and-motion studies to measure labor productivity. His data-driven insights redefined managerial decision-making.
Film still from a pioneering study by Lillian Gilbreth and Ralph Barnes (1910–1924). Using motion-picture analysis to record factory tasks, they developed motion study techniques that advanced systematic approaches to business intelligence and laid foundations for data-driven management in early 20th-century industry. Source: Archive.org
In the early 20th century, the pioneering films by Lillian Gilbreth and Ralph Barnes, investigating industrial operations and developing motion study techniques (1910-1924), further advanced the systematic approach to business intelligence. Their work laid the foundation for the growing use of data to streamline operations and decision-making.
Soon after, Henry Ford adapted such techniques to refine production lines, timing the manufacture of each component and embedding measurement into industrial practice.
A42_BUSINESS_INTELLIGENCE
A44_MECHANICAL_ENTRY
Business intelligence reframed the interface between knowledge and decision. Instead of relying on instinct or rumor, merchants and managers began to consult standardly shaped documentation. These tools structured attention, showing what could be measured and optimized. The interface here was not a machine but a format of observation, guiding to consider labor, trade, and risk in advance.
A44_MECHANICAL_ENTRY
From Cash Registers to Calculators — Mechanizing the Ledger
The industrial push to mechanize business records brought calculating devices out of labs and into the workplace. In 1879, Ohio saloon owner James Ritty and inventor John Birch patented the “incorruptible cashier,” a mechanical register designed to prevent employee fraud.
Models were soon enhanced with paper rolls for printed receipts, turning cash registers into trusted tools for recording financial transactions. This innovation led to the founding of companies like Burroughs and National Cash Register, which later pivoted into the computing industry.
Meanwhile, Swedish engineer Willgodt T. Odhner, working in St. Petersburg (Russian Empire), developed a compact mechanical arithmometer in the 1870s. His device, refined over decades, became a standard in Soviet administrations and was marketed in the West under the “Facit” brand.
Blueprint of the cash register and indicator from U.S. Patent No. 221360, filed by James and John Ritty on November 4, 1879. Google Patents
Illustration of Odhner’s arithmometer from the magazine “Science and Life” (Nauka i zhizn), No. 45 (1890). Life and Science
A44_MECHANICAL_ENTRY
A46_MEMEX_VISION
The cash register and arithmometer reshaped the act of entry itself. Keys, cranks, and printed receipts created a new interface between users and numbers, turning abstract sums into immediate feedback. For clerks and shopkeepers, calculation was no longer hidden labor but a visible, audible process — a bell, a roll of paper, a mechanical click — making data part of the everyday encounter with machines.
A46_MEMEX_VISION
MEMEX and the Dream of Personal Data Trails
In 1945, Vannevar Bush envisioned the Memex, a desk-sized device designed to help users link and retrieve vast amounts of information. Users could create personalized trails connecting photos, notes, and documents, anticipating modern hypertext.
Sketch from Vannevar Bush’s article “As We May Think,” republished in ACM SIGPC Notes (1979). Worrydream
Though never built, the Memex influenced the development of interactive data systems and user interfaces, bridging business data with human memory and creativity. It foreshadowed the personal computer and the idea of navigating data as a cognitive tool, not only storing facts.
A46_MEMEX_VISION
Supercluster B
With the Memex, the interface became a thought experiment — Bush imagined a desk where knowledge could be navigated through associative links. Trails of documents and notes suggested that data could follow the logic of memory itself. Even as a vision, the Memex reframed the interface: not as a fixed form but as a dynamic pathway, personal and expandable, anticipating new ways of handling information.
***
From clocks to cards and visionary desks, these stories show how every interface framed a relationship between humans and data. They were not passive conduits but active shapers: clocks taught citizens to read time, registers trained subjects to fill fields, machines disciplined clerks to strike keys.
By the mid-20th century, the range of interfaces had expanded from ritual artifacts to speculative designs like the Memex. What united them was the conviction that knowledge could be organized through forms of interaction — a legacy that would set the stage for the more system-wide infrastructures that followed.
The Database as Representation — Modeling, Meaning, and Mediation
Mid-century computing brought a decisive shift in the nature of interfaces. No longer confined to individual desks and ledgers, interaction with data began to take shape as whole systems.
UNIVAC and its successors did more than accelerate arithmetic — they consolidated storage, logic, and reporting into environments where clerks, managers, and planners now worked through a shared electronic medium. The database emerged not as a neutral container but as a representational tool, modeling organizations, processes, and decisions within its structures.
B1
UNIVAC: Systems of Access and Authority
UNIVAC introduced a new way of meeting data: it pulled together input, processing, and output into one environment, absorbing cards, printouts, and operator routines into a system that carried its own authority. For operators it still looked like office work — stacks of cards, consoles, printed reports — but the interaction was qualitatively different.
B11_UNIVAC
UNIVAC I — Betting on Electronic Processing
UNIVAC central panel, used by operators to control programs and monitor machine status through switches and indicator lights. Photo by Don DeBold. Source
The UNIVAC I (Universal Automatic Computer I), introduced in 1951, was the first digital computer designed for commercial use in the United States. It was a room-sized system powered by thousands of vacuum tubes, using magnetic tape drives along with punch cards. UNIVAC could execute approximately 1,905 operations per second, and it employed mercury delay line memory capable of storing 1,000 words of 12 characters each.
This hardware allowed UNIVAC to handle both numeric and alphabetic data at unprecedented speeds for its time. It was programmable, universal in purpose, and significantly outpaced earlier mechanical and electromechanical systems.
The machine sold for between $1.25 and $1.5 million, which limited its potential to spread across industries. But its cultural impact was such that it quickly became a symbol of the new era of machine-powered thinking.
B11_UNIVAC
B12_UNIVAC_CENSUS_GE
UNIVAC’s first installations revealed the hybrid nature of its interface: at once recognizable and unsettling, it condensed office work into machine form. What mattered was not only speed but how the machine made process and result cohabit in one environment — an arrangement that clerks now had to navigate as routine.
B12_UNIVAC_CENSUS_GE
UNIVAC in Practice — From Census to Payroll
UNIVAC’s debut wasn’t in theory — it was in practice. The U.S. Census Bureau became the first non-military, non-academic institution to operate an electronic digital computer. The agency used it to tabulate census data, performing large-scale record matching and statistical analysis that would have taken human clerks weeks or months.
A UNIVAC computer at the U.S. Census Bureau (c. 1960). Source: U.S. Census Bureau
This early deployment in 1951 was so successful that the Bureau later declared UNIVAC had never been involved in any error incident — a powerful vote of confidence in machine logic at a time when skepticism ran deep. Soon after, General Electric became the first private business to use UNIVAC, adopting it for payroll computation.
At the time, IBM dominated government installations. Their tabulators were already embedded across agencies. Many public-sector computing offices were effectively IBM-run — staffed by former IBM employees, running IBM systems, and thinking in IBM workflows. UNIVAC, though technically superior, was considered an outsider.
As one official put it:
“If I recommend UNIVAC and it fails, I made a mistake. If I recommend IBM and it fails, IBM made a mistake.”
B12_UNIVAC_CENSUS_GE
B13_UNIVAC_GOVERNMENT
Once organizations accepted UNIVAC into their daily workflows, the interface confronted tougher tests. In government and military contexts, legitimacy outweighed efficiency. An output was only useful if it carried the visual and procedural authority of documents that anchored hierarchy and command.
B13_UNIVAC_GOVERNMENT
UNIVAC in Government and Military — Cold War Logistics
By the mid-1950s, the U.S. Air Force and other federal agencies had adopted UNIVAC systems for logistical planning, missile tracking, and resource scheduling. These systems weren’t designed for battlefield control, but served instead as part of the administrative backbone of Cold War operations.
UNIVAC’s ability to process alphabetic data was a major advantage, allowing for more complex record-keeping and scenario modeling than number-crunching machines alone.
Air Force enlisted specialists operating a UNIVAC computer (July 28, 1956). Source: Special Collections and Archives; Wright State University Libraries
Toward the end of the decade, Remington Rand’s UNIVAC division was bidding alongside IBM for government defense contracts, embedding itself in the infrastructure of federal automation. Unlike IBM’s tightly controlled systems, UNIVAC’s flexibility and tape-based I/O made it attractive for unconventional environments — from defense logistics centers to early weather modeling programs.
B13_UNIVAC_GOVERNMENT
B14_UNIVAC_ENGINEERS
To secure that legitimacy, UNIVAC had to be staged as something recognizable. Eckert and Mauchly’s talent was partly in translating logic into levers, dials, and displays executives could read as continuities with older systems. This performance of familiarity became an interface in itself, aligning radical technology with bureaucratic expectations.
B14_UNIVAC_ENGINEERS
UNIVAC Engineers — From Startup to Corporate Backing
J. Presper Eckert and John Mauchly, already known for ENIAC, left wartime research to form the Eckert–Mauchly Computer Corporation. Their aim was to build a “universal automatic computer” that could handle business records as easily as equations.
UNIVAC began not with a corporation but with two engineers pushing an idea beyond ballistics. But their startup struggled: capital was scarce, the market uncertain, and the technology untested.
In 1950, the project was absorbed by Remington Rand, a typewriter and office-equipment giant with money and distribution power. That merger kept the machine alive — and with it, the possibility of a commercial computing industry.
B14_UNIVAC_ENGINEERS
B15_UNIVAC_SYMBOL
Once stabilized under corporate control, UNIVAC acquired a second layer of interface — display as persuasion. Lights, reels, cabinet lines, the choreography of operators — these became a public vocabulary for machine authority.
B15_UNIVAC_SYMBOL
UNIVAC as Cultural Symbol
UNIVAC entered public consciousness in 1952, when CBS used it to predict the outcome of the U.S. presidential election. The machine signaled Eisenhower’s victory hours before most commentators were willing to commit, turning a broadcast into a national spectacle. For many Americans, this was the first moment a computer appeared as an authority, its output treated as a credible forecast rather than a technical curiosity.
UNIVAC advertisement from “Time” magazine (1967). Source: Poshmark
The UNIVAC name soon spread beyond the machine itself — borrowed in fiction, headlines, and advertising. Its visual form became equally iconic: glowing panels, magnetic tape reels, blinking lights. These elements circulated in media and corporate branding, establishing a recognizable aesthetic of computation in the 1950s and 1960s.
B15_UNIVAC_SYMBOL
B18_CER
The display language of UNIVAC spread widely, but its meanings were not uniform. In the Soviet Union, projects like Glushkov’s Dnipro machine explored how electronic systems might extend planning and coordination, embedding the interface in the logic of the planned economy. These experiments showed that computing could become a national infrastructure of authority as much as a technical tool.
B18_CER
CER — Yugoslavia’s Independent Computing Path
Yugoslavia entered the digital age in the 1960s and 1970s with the CER (Cifarski Elektronski Računar) series, developed in Belgrade by the Mihajlo Pupin Institute. It was one of the first independent national computing initiatives outside the United States and the Soviet Union.
Early models like the CER-10 used transistor-based architecture with punched cards for input, later adding magnetic tape for storage and backup. The system featured 4 KB of magnetic core memory, expandable in later versions, and processing speeds in the tens of thousands of operations per second.
CER-10 computer at the Tanjug building (1963). Photograph by Dušan Hristanović.
CER machines were applied to scientific research, state statistics, and media tasks such as automated news distribution. They played a central role in modernizing Yugoslavia’s administrative and information infrastructure.
B18_CER
Cluster B2
From business offices to Cold War agencies, from corporate branding to national laboratories, the interface evolved as the essential layer of mediation. It absorbed routine gestures and projected machine logic into public culture and politics.
UNIVAC, CER, and the Soviet Dnipro show how early computers were not simply faster tools but environments that organized trust, power, and identity through the very forms of interaction they required.
B2
Information Inventory — Dreams of Integrated Data
Where UNIVAC consolidated office routines into a single system, the next ambition was to imagine enterprises themselves as data environments. Experiments with early data models showed how the metaphor of inventory could be translated into practice, giving organizations their first glimpse of electronic systems as maps of themselves.
B23_WEYERHAEUSER_IDS
Weyerhaeuser IDS — A Real-Time Business Network
In 1965–1966, Weyerhaeuser, a major U.S. timber company, became the first non-GE customer to implement IDS — turning the database into the foundation for a real-time, nationwide business system.
Sales brochure for the GE-200 series computer (1960s). The platform was later used for early IDS implementations. Source: Ferretonix.com
The setup linked over 100 remote teletype terminals to a central GE-235 computer using a DATANET-30 network. Orders placed across the country were entered directly into the system, which updated inventory, managed shipping logistics, and generated invoices.
The system used Problem Controller, an early form of online transaction processing (OLTP), to prioritize and manage concurrent requests. At peak demand, transaction volumes briefly overwhelmed the system, but the architecture proved robust and adaptable.
B23_WEYERHAEUSER_IDS
B24_SOVIET_PARADOX
By wiring remote terminals into a shared system, Weyerhaeuser’s installation turned the interface into an organizational nervous system. Everyday actions — logging orders, tracking shipments, issuing invoices — were mediated through a computer. If a timber company could absorb such immediacy, the question became whether entire states could withstand the same transformation of authority.
B24_SOVIET_PARADOX
The Soviet Information Paradox — Power, Plans, and Resistance
By the late 1950s, the Soviet Union faced a contradiction: while its military and scientific sectors deployed digital computers with growing sophistication, civilian institutions — especially Gosplan, the State Planning Committee — remained wary of adopting the same tools.
The USSR had previously used imported tabulators like Powers and Hollerith machines, later building its own analogs such as the T-5, exported to other socialist countries. But the leap to electronic computing was politicized. Even as Gosplan quietly launched its own Computer Center in 1959 and installed its first Ural-2 machine in 1960, internal resistance to large-scale data automation persisted.
Fidel Castro at the Main Computer Center of the USSR State Planning Committee, Moscow (1972), with Nikolai Baibakov, chairman of Gosplan, and Nikolai Lebedinsky, head of the center. Source
The paradox deepened in the 1960s. Despite new equipment — including British Elliott 403 and ICL System-4 machines — and cooperation with East Germany on ALGOL translators, Gosplan remained cautious.
A proposed national automation system, the OGAS network, led by cybernetician Victor Glushkov, envisioned a nationwide digital system for economic planning. But it was blocked — not due to technical failure, but because it threatened existing institutional control over data flows. In the Soviet model, information was not only infrastructure but also political power.
B24_SOVIET_PARADOX
B25_OGAS_PROJECT
In the Soviet Union, the barrier was not capacity but control. Interfaces that promised transparency threatened the authority of clerks and ministries who managed flows of paper. Victor Glushkov’s vision pushed against this inertia: his Dnipro systems suggested how digital mediation might scale, and his OGAS proposal imagined an interface spanning the whole planned economy.
B25_OGAS_PROJECT
OGAS — The Internet That Almost Was
In the 1960s, Soviet cybernetician Victor Glushkov proposed a nationwide network of computers to manage the USSR’s economy in real time. Called OGAS (Общегосударственная автоматизированная система учёта и обработки информации), or the National Automated System for Computation and Information Processing, it aimed to unify factories, ministries, and planners in a single, continuously updated digital infrastructure.
The proposed system included regional computing centers linked to central hubs in a three-tier architecture, real-time inputs from across industries, and automated modeling to aid planning. Terminals were planned for remote enterprises, from industrial plants to mining sites and state-owned farms.
Glushkov’s team at the Kyiv Institute of Cybernetics had experience in systems design, and prototypes for smaller-scale implementations already existed. But OGAS never launched.
Victor Glushkov with Tadeusz Marjanovich, who led process-modeling research at the Kyiv Institute of Cybernetics. Near Kyiv, 1970s. Source: Glushkov family archive
The system promised transparency, efficiency, and redistributed authority, challenging the entrenched gatekeepers of economic knowledge. Despite repeated proposals through the late 1960s and early 1970s, OGAS was quietly defunded, gutted, and eventually abandoned.
B25_OGAS_PROJECT
B26_GE225_VS_IBM1401
OGAS revealed the political weight of interface design. To make information accessible across factories and ministries was to redistribute power, and the project stalled under those tensions. Meanwhile in the West, the debate played out not in ministries but in markets: whether the interface should feel safe and familiar, or open to extensibility and integration.
B26_GE225_VS_IBM1401
GE-225 vs IBM 1401 — Rival Models of Business Computing
In the early 1960s, two very different machines shaped how organizations approached digital information: the General Electric GE-225 and the IBM 1401.
The GE-225, introduced in 1960, was built for power and flexibility. It featured simultaneous input/output handling, supported both alphabetic and numeric data, and could connect to disk drives like MRADS. Input came from magnetic tape, punched cards, MICR documents, and even paper tape, with long-distance connections supported via the DATANET-15. It was a machine for custom-built systems like real-time data integration.
Meanwhile, the IBM 1401, released in 1959, took the market by storm with its affordability and reliability. Its six-bit character system, magnetic core memory (4K–16K), and decimal arithmetic made it perfect for payroll, billing, and inventory. Leased for around $2,500/month, it brought computing within reach of small and mid-sized businesses — earning the nickname "the Model T of the computer industry."
IBM 1401 computing the results for the city of Kiel, West Germany, during the federal election (1965). Source
Their rivalry wasn’t just about specs — it was about philosophies:
- IBM offered safe, standardized tools for the mainstream.
- GE pushed toward modularity, extensibility, and integration.
The GE-225 later found academic life as well — a time-sharing version at Dartmouth became the birthplace of the BASIC programming language.
B26_GE225_VS_IBM1401
Cluster B3
Weyerhaeuser’s terminals, Glushkov’s Dnipro and OGAS plans, and the rival philosophies of IBM and GE all pointed to the same turning point: the interface was no longer a matter of single users and their consoles but of entire systems.
It mediated flows across companies, bureaucracies, and economies, shaping who could see, decide, and command. In this shift, the database era took form as a struggle over how widely — and how openly — data could circulate.
B3
COBOL: From Business Language to Standard
COBOL — the Common Business-Oriented Language — was the first widely adopted programming language designed for managers, clerks, and auditors as much as for engineers. Conceived in 1959 through the CODASYL committee and inspired by Grace Hopper’s FLOW-MATIC, it gave business processes a direct linguistic form.
Instead of mathematical notation or symbolic code, programmers wrote instructions in phrases resembling office documents: ADD TAX TO TOTAL, MOVE BALANCE TO REPORT.
This shift made COBOL both a language and an interface. It allowed people without deep technical training to read and verify what software was doing, while also ensuring that the same code could run across different computer systems. For the first time, software became a shared medium between machines and institutions, where business rules were recorded as lines of text that doubled as executable programs.
B33_EARLY_COBOL_APPLICATIONS
Early COBOL Applications — From Contract Coding to AUTOFLOW
COBOL’s standardization opened the door to an entirely new market: commercial software development. In 1959, Advanced Data Research (ADR), a New Jersey–based firm, began offering contract programming services, specifically advertising COBOL expertise in Datamation magazine by 1961.
Advertisement for AUTOFLOW, a programmers’ assistance tool, in Datamation magazine (June 1966). Source: Bitsavers
One of ADR’s key products was AUTOFLOW, an application that automatically generated flowcharts from COBOL source code. At a time before video terminals, visualizing program logic on paper was essential. AUTOFLOW helped users trace and document complex logic paths, making it easier to debug, explain, or maintain large-scale software.
B33_EARLY_COBOL_APPLICATIONS
B35_COBOL_READABILITY_INTERFACE
Tools like AUTOFLOW made program logic visible on paper, turning COBOL code into flowcharts that could be read, traced, and explained. This translation of machine instructions into diagrams showed that interfaces were not confined to consoles or printouts: they could also be conceptual, giving shape to the invisible workings of software.
B35_COBOL_READABILITY_INTERFACE
COBOL as Interface — Programs in Plain English
COBOL’s breakthrough was linguistic. Business software could now be written in something resembling natural English, with syntax drawn from everyday office practice. Instead of abstract math or dense assembly, programmers used phrases like MOVE TOTAL TO SUMMARY-TOTAL. This made programs legible to non-programmers and reframed coding as documentation.
Grace Murray Hopper, Rear Admiral and computer pioneer, in her Washington, D.C. office (1978). She often lectured in uniform, using her Navy role to underscore authority in a male-dominated field, though in everyday work she wore civilian clothes. Photograph by Lynn Gilbert. Source
This readability was deliberate. Grace Hopper and the CODASYL committee wanted software to be transparent, teachable, and aligned with how people already communicated. By borrowing vocabulary and structure from business memos and accounting reports, COBOL positioned itself as a mediator between humans and machines.
B35_COBOL_READABILITY_INTERFACE
Cluster B4
COBOL’s trajectory carried it far beyond its Pentagon origins. It became a contract service offered in magazines, a tool for automating diagrams like AUTOFLOW, and eventually a global standard translated into Soviet variants.
What united these contexts was the way the language itself functioned as an interface: code that managers could read, auditors could verify, and machines could execute. By collapsing instruction and documentation into the same form, COBOL gave institutions a durable medium for expressing authority in data.
B4
Business Data Management: Systems, Standards, and Scale
As COBOL turned code into institutional language, the interface expanded again — from programs that mirrored office memos to infrastructures that bound together entire industries. The emerging question was no longer just how to make software legible, but how to ensure information could circulate across machines, organizations, and even continents.
The interface became systemic: a set of standards, networks, and devices that made interaction with data continuous, distributed, and real-time.
B42_DBMS_IBM_USERGROUPS
IBM’s Role — User Groups and the Rise of IMS
In 1957, IBM users formed SHARE and GUIDE groups to collaborate on programs for new hardware. Projects like SURGE and 9PAC extended the IBM 704/709’s capabilities. Though IBM didn’t develop them, it later supported and maintained 9PAC, seeing its value. These early systems experimented with data dictionaries, file hierarchies, and routines for migrating between hardware environments.
Apollo–Soyuz spacecraft in Earth orbit, docked configuration. NASA diagram (1974). North American Rockwell and IBM collaborated on systems for the Apollo program. Source: NASA Collection, S74-05269
Still, tape-based storage had limits. The real breakthrough came when IBM pivoted to disk — and partnered with aerospace contractor North American Rockwell to build IMS (Information Management System). Originally developed to manage components for the Apollo program, IMS pioneered hierarchical data models and multitasking data access.
By the late 1960s, IMS ran on IBM’s System/360 and supported multiple concurrent applications from a single memory image. IBM states that IMS still supports 95% of Fortune 1000 companies today.
B42_DBMS_IBM_USERGROUPS
B43_DBMS_HARDWARE
IBM’s user groups revealed that software standards could themselves function as interfaces. By pooling code and practices across organizations, they created shared conventions that outlived any one machine. The next leap was to inscribe those conventions into hardware, building systems explicitly designed to support multiuser access and hierarchical databases.
B43_DBMS_HARDWARE
System/360 and Beyond — Hardware for Databases
IBM’s System/360, launched in 1964, introduced modular computers with upgrade paths, standardized architecture, and compatibility across a wide range of peripherals. Its design popularized the 8-bit byte, data channels, and 9-track magnetic tape, pushing the industry toward mass production and interoperability. European and Japanese manufacturers soon followed, building IBM-compatible systems.
IBM System/360 mainframe at the opening of The Washington Data Processing Center (April 1, 1966). Statistical Reporting Service of USDA Administrator Harry Trelogan looks on as Agriculture Secretary Orville Freeman tests out some of the functions. Photo courtesy of the National Archives and Records. Source: US Department of Agriculture Flickr
Key hardware elements for early database management included:
- Magnetic tape drives for sequential backups and bulk data archiving.
- DASDs (Direct Access Storage Devices) for fast, random access to structured data.
- Punched cards and paper tape as legacy media for data entry and programs.
- Terminals such as the IBM 2260 and Univac Uniscope, which enabled full-page interaction and gave users real-time access to enter, correct, and visualize data.
B43_DBMS_HARDWARE
B44_SABRE_SYSTEM
System/360 turned the computer into a modular environment where interfaces stabilized across generations. Terminals, storage, and peripheral devices could be mixed and upgraded without abandoning established workflows. This made it possible to imagine real-time interaction as an everyday business function.
B44_SABRE_SYSTEM
SABRE — The First Real-Time Business System
In the late 1950s, a spontaneous meeting between IBM and American Airlines executives on a flight sparked the idea for a computerized reservation system. Drawing from IBM’s military experience with the SAGE air defense system, the two companies built SABRE — the Semi-Automated Business Research Environment.
American Airlines SABRE advertisement showing the network of its computerized reservation system (late 1960s). Source: Tails Through Time
Launched in 1960, SABRE became the world’s first commercial real-time data system, handling 83,000 bookings per day via two IBM 7090 mainframes. Its interactive model allowed agents to check seat availability, confirm tickets, and update records instantly, replacing manual booking processes.
B44_SABRE_SYSTEM
B45_OLYMPICS_DB
SABRE’s reservation consoles showed that the interface could be immediate, transactional, and distributed across thousands of users. What had once been a back-office task became a live negotiation between customer, agent, and machine.
B45_OLYMPICS_DB
Tokyo Olympics 1964 — Real-Time on a Global Stage
The 1964 Tokyo Olympics posed a monumental data challenge: 7,000 athletes, 100 countries, and up to 25 simultaneous contests across 32 venues. To manage this, IBM Japan deployed a real-time data processing system that transformed event coordination forever.
Data-printing center in the Olympic Village, Tokyo (1964). Source: Official Games Report
Using 62 IBM 1050 terminals across venues, scores were sent to a central Olympic Data Center powered by eight IBM computers. With a disk capacity of 56 million characters, the center processed rankings, judge scores, and registration data for 12,000 participants — within seconds. Over 100,000 messages were expected, with three to four times as many replies sent back.
B45_OLYMPICS_DB
Cluster B5
The shift from reports to databases and the introduction of teleprocessing established a new horizon: data as an infrastructure of coordination, with the interface as the layer that connected people, machines, and institutions at scale.
B5
Foundations of Data Handling: From Batch Runs to Transactions
As databases and networks grew in ambition, the routines of everyday computing still depended on how data was processed, displayed, and controlled. Interfaces here were not always glamorous, but they were formative: they trained users, structured expectations, and set the stage for later graphical environments.
B51_BATCH_VS_OLTP
Batch vs. Online Processing — From Census to Seats
By default, early computing relied on batch processing — collecting data over hours or days, then feeding it into a system for a single, uninterrupted run. This was ideal for repetitive, large-scale jobs like payroll or census tabulation. The method emphasized efficiency in an era when computer time was scarce and expensive.
Brochure page for the 1101 Keyed Data Recorder, Mohawk Data Science Corporation (1965). Source: Internet Archive
The shift to Online Transaction Processing (OLTP) enabled systems to handle data in real time, allowing for immediate response to user input. The change was made possible by new magnetic disks (offering random access), faster processors, and networked terminals.
B53_REPORT_TABULATION
Reporting and Tabulation — Early Business Intelligence
Before the rise of graphical interfaces and data dashboards, businesses made sense of information through structured printouts — organized columns of numbers, names, and dates. This was the world of reporting and tabulation, where value lay in turning raw machine data into readable summaries.
Brochure page for the Portable Addressograph, Addressograph-Multigraph Corp. (1950s). Source: Internet Archive
Computing’s main output in this era was text, and layouts were built with typewriters and line printers. Custom-coded routines used spacing and symbols, inserted headers, pagination, totals, and alignment, giving readers a way to scan, compare, and analyze continuous-form paper visually.
Draftsmen working on a blade template drawing at a large table (1953). Source: NASA/Glenn Research Center collection
Even without graphics, sales reports, inventory sheets, and payroll summaries transformed raw bits into managerial knowledge. The software behind these outputs became precursors to later business intelligence tools.
B53_REPORT_TABULATION
B54_EARLY_INTERFACES
Structured printouts disciplined attention: they taught managers to read columns, totals, and summaries as signs of performance. Yet they also pointed to a visual hunger — the need to see order at a glance, not just in lines of figures. As layouts grew more sophisticated, the question shifted toward control — how users could not only read results but direct the machine themselves.
B54_EARLY_INTERFACES
Early Interfaces — Command Lines and Control Panels
Early computers didn’t greet users with icons or buttons. Interaction meant command-line precision, punched card stacks, and binary switches. Human–machine communication was intense, physical, and deeply technical.
“A Fable for Computer Users,” Control Data Corporation booklet, 1960s. Source: Internet Archive.
“A Fable for Computer Users,” Control Data Corporation booklet, 1960s. Source: Internet Archive.
Users were mostly operators, engineers, and programmers — not everyday clerks or analysts. Programs were written in machine code or assembly, entered via punch cards or front-panel switches. The idea of a “user-friendly” system simply didn’t exist.
Control panels featured toggle switches, status lights, and manual overrides. Later came command line interfaces (CLIs), where users had to type exact instructions. A single typo could crash an entire batch run.
To improve efficiency, Job Control Languages (JCLs) emerged — scripts that told the computer what to do, in what order, and how to handle results. This was automation before the GUI.
Meanwhile, efforts to standardize peripheral interfaces, data formats, and operating procedures foreshadowed the shift toward interoperable systems. Symbolic abstractions like mnemonic codes pointed toward usability, but the user was still a technician, not a typist.
B54_EARLY_INTERFACES
Supercluster C
What emerged was a culture of interaction where data handling was procedural, precise, and tightly coupled to the machine’s logic. These foundations made later graphical environments imaginable, because they had already taught people to expect dialogue with data — even if at first it came in the form of queues, reports, and terse commands.
Relational Interfaces — Querying, Rules, and Everyday Data
The next step in data interaction moved beyond routines and syntax toward structure itself. Relational databases treated information as tables, defined by consistent rules and accessible through a shared logic. Where earlier systems demanded knowledge of storage and sequence, the relational model allowed users to pose questions in abstract terms, leaving the system to decide how to answer.
This shift created a new kind of interface: a framework that promised universality. Data could be joined, compared, and updated without reference to physical layout, and a common query language soon carried these operations across companies and industries. Relational systems became the environment where interaction with information felt both standardized and open-ended — a grammar for the age of databases.
C1
Codd and the Relational Revolution
In 1970, Edgar F. Codd proposed a new foundation for databases: relations governed by algebra, keys, and domains. His idea of data independence separated storage from logic, so that queries could address meaning rather than mechanics.
C12_RELATIONAL_HARDWARE
IBM Context — Hardware First, Ideas Later
Codd’s work on the relational model was rooted in IBM’s dramatic hardware evolution. In the early 1960s, he worked with the IBM 7090, a transistorized mainframe widely used for scientific and business computing. Bulky by today’s standards, it nonetheless laid the groundwork for systematizing data operations.
A meteorologist at the console of the IBM 7090 electronic computer in the Joint Numerical Weather Prediction Unit, U.S. Weather Bureau (c. 1965). The 7090 underpinned early business computing and formed part of Codd’s working environment. Source: National Oceanic and Atmospheric Administration
By the late 1960s, IBM introduced the System/360, a platform that unified architectures for business and scientific applications. Its design brought direct-access storage devices (DASDs) — a crucial step toward random-access data retrieval and, eventually, relational systems.
Page with mainframe console image from the IBM System/360 sales brochure (1964). The 360 symbolized scalable computing — groundwork for relational systems in business. Source: Computer History Museum
Codd’s vision explicitly abstracted away hardware dependence, promoting logical organization over machine constraints.
C12_RELATIONAL_HARDWARE
C13_RELATIONAL_HONEYWELL
Relational thinking emerged inside IBM at a moment when machines still set the terms of interaction. The 7090 and System/360 were framed as corporate interfaces themselves: consoles, storage devices, and job control routines. Codd’s proposal to abstract away from hardware dependence was not a rejection of this environment but a redefinition of it — moving the interface from physical controls toward logical organization.
C13_RELATIONAL_HONEYWELL
MRDS on Multics — The First Relational System
In the mid-1970s, the Multics Relational Data Store (MRDS) became the first commercial implementation of Codd’s relational model. At Honeywell’s Phoenix facility, Jim Weeldreyer and Oris Friesen led its development, drawing on Codd’s theoretical framework while working in parallel with early relational projects such as IBM’s System R and Berkeley’s Ingres.
Midtown Phoenix, Arizona (1970s). Honeywell’s Phoenix facility developed MRDS here, an early hub of relational database innovation. Source: Rogue Columnist
Running on the secure, time-sharing Multics operating system, MRDS took advantage of virtual memory and was written in PL/1. Its design allowed users to access and manipulate structured data using high-level relational commands. In 1976, Honeywell marketed MRDS as part of the Multics Data Base Manager (MDBM), which also included a CODASYL-style layer.
Diagram from the MRDS Manual (1981), showing the Relational Data Source Model — one of the first real-world implementations of relational principles for structured business data. Source: Bitsavers
C13_RELATIONAL_HONEYWELL
C14_CODD_RULES
Running on a secure, time-sharing operating system, MRDS showed that tables and high-level queries could be embedded in everyday workflows. It was still austere — terminals and command lines — but it offered a glimpse of relational principles translated into an operational interface rather.
C14_CODD_RULES
Codd’s 12 Rules — The Blueprint for Relational Databases
As vendors rushed to sell products branded “relational,” Edgar Codd intervened to separate marketing claims from architecture. In two Computerworld articles (October 14 and 21), he introduced a framework for judging whether a system truly followed relational principles.
Herald Square elevated railroad and Sixth Avenue with R.H. Macy & Company department store in the background, New York (c. 1910s–1930s; published 1949). After emigrating from England, Edgar F. Codd briefly worked in Macy’s men’s department before turning to computing; within two decades he introduced the relational model and later received the Turing Award for it. Source: Library of Congress, Prints & Photographs Division, Detroit Publishing Company Collection
Codd’s 12 rules — actually 13, counting Rule Zero — outlined what a genuine relational database must provide. Rule Zero required that a DBMS manage data strictly through relational methods, not as a façade over hierarchical or network systems. The remaining rules specified fundamentals such as data independence, accessible metadata, set-based operations, and logical consistency.
One practical rule emphasized multiple-record-at-a-time processing: a single command should update entire sets — raising all prices by 10% or changing every Polish address to “Warsaw, Poland.” This stood in contrast to earlier one-record-at-a-time approaches.
C14_CODD_RULES
Cluster C2
As relational ideas spread, Codd’s rules became a filter, teaching users how to tell the difference between branding and architecture.
C2
Practical Birth of Relational Databases
By the mid-1970s, IBM’s San Jose lab set out to prove that Codd’s relational model could work in practice. The experiment was called System R. It was designed not as a theoretical demo but as a full environment: language, storage, and transactions bound together. Here, relational ideas met the realities of use, showing what it meant to interact with data through commands that described what was wanted rather than how to retrieve it.
C22_SYSTEMR_USE_CASES
Real-World Trials — System R in Industry
In the late 1970s, IBM partnered with real-world users to validate the relational model’s performance in live environments. The first major test came in 1977, when Pratt & Whitney, a jet engine manufacturer, used System R to manage parts and inventory.
Pratt & Whitney Aircraft duct burner (1979). System R tracked fine-grained logistics during jet engine assembly, ensuring no parts were left behind. Source: NASA / Glenn Research Center Collection
Shortly after, Upjohn Pharmaceuticals deployed it to track clinical research data for FDA applications. While these early adopters didn’t leverage features like concurrency, locking, or transactions to their fullest, they proved relational systems could serve serious industrial use cases.
Upjohn compensation formula table (late 1970s). The company stored experimental data in System R during clinical trials. Source: Corporate archival material
Among the growing pains IBM engineers faced was the “Halloween Problem,” discovered on October 31, 1976. Updates to a table could cause rows to re-enter a scan and be modified repeatedly — a quirk that haunted the SQL optimizer until engineers redesigned update handling. Despite these challenges, the project’s success was undeniable: it laid the groundwork for SQL/DS (1981) and the launch of IBM DB2.
C22_SYSTEMR_USE_CASES
C23_SYSTEM_R_ANECDOTES
When IBM offered System R to outside partners, the challenge was credibility. Could a declarative query style carry the weight of industrial workflows? The pilots became proving grounds where engineers and managers judged whether this unfamiliar way of addressing data could support real decisions.
C23_SYSTEM_R_ANECDOTES
Tales from the SQL Team — Memory, Humor, and Liquor Walls
System R’s developers left behind stories that were as colorful as their code. Don Chamberlin recalled a memorable visit to Upjohn Pharmaceuticals in Kalamazoo, Michigan — where the team had installed System R to manage clinical research data. Their hosts lodged them in a Victorian mansion with tandem bikes and a full liquor wall: “We asked if we could take home anything we didn’t drink.”
Company sign spotted by System R engineers during a tour of the vitamin production line (late 1980s). Source: Upjohn
Beyond these surreal moments, IBM tested System R in diverse settings: attack helicopter design at Owego, GUI prototypes at the Santa Teresa Lab, and natural-language querying in the REQUEST project at Yorktown. International installations extended its reach from Tokyo to Heidelberg.
C23_SYSTEM_R_ANECDOTES
Cluster C3
Working on System R often felt like stepping into uncharted territory. Every installation carried the thrill of improvisation — a mix of technical risk, new business practices, and the social rituals that came with embedding software in unfamiliar settings. The atmosphere was one of adventure: a research prototype venturing into the world, still uncertain yet already reshaping how people connected with data.
C3
SQL and the Language of Databases
The upcoming shift in database design was not about hardware or storage but expression. For the first time, users could interact with data through language rather than procedures or control panels. Queries became sentences — structured yet readable — turning the interface into a space of communication instead of manipulation.
C31_SQL_CONCEPT
From SEQUEL to SQL — Making Relations Speak
SQL began as a bold attempt to turn Ted Codd’s mathematical vision into something users could actually type. In the early 1970s, Don Chamberlin and Ray Boyce designed SEQUEL — a query language built not on logic symbols, but on readable templates like “SELECT” and “FROM.”
The language pioneered a declarative style: describe the data you want, rather than the steps to retrieve it. SEQUEL’s syntax mimicked English and allowed queries to be composed like building blocks. It was designed as a bridge for analysts, scientists, and business users, not programmers alone.
Query templates from the article “SEQUEL: A Structured English Query Language” by Donald Chamberlin and Raymond Boyce, showing how relational operations were expressed in readable, English-like statements. Source
The name “SEQUEL” was shortened to SQL after a trademark dispute with British aerospace firm Hawker Siddeley. Don Chamberlin recalls dropping the vowels to echo languages like APL.
While SQL began as an internal IBM research effort, it was soon picked up in academic experiments and commercial projects alike, laying the foundation for relational databases as everyday tools.
C31_SQL_CONCEPT
Cluster C4
Commercial systems adopted SQL, universities taught it, and a growing community of users learned to phrase questions through its compact syntax.
By the mid-1980s, international standards fixed SQL as a common surface across machines and vendors. Whatever hardware or company lay behind the scenes, the interface looked the same. SQL had become a shared skill, turning database access into a consistent experience that could travel from classrooms to corporate offices worldwide.
C4
Commercial Expansion of Relational Systems
With SQL established, relational databases entered the world of products and platforms. Their interfaces now depended less on syntax than on context. Bundled with operating systems, adapted to smaller machines, and promoted as reliable business tools, relational computing became part of the everyday office environment.
C41_MULTICS_MRDS
Honeywell’s MRDS — The Other First Mover
In June 1976, Honeywell introduced the Multics Relational Data Store (MRDS), the first relational database management system released by a major vendor. Built directly into the Multics operating system, MRDS let users query data through relational algebra and predicate calculus. It coexisted with the Multics Integrated Data Store (MIDS), a hierarchical model, giving organizations a rare choice between competing paradigms.
System control panel for Honeywell 6000 series mainframes, the hardware platform supporting MRDS (1980s). Source
Multics’ design emphasized security and multi-user access, qualities that MRDS inherited. Although its reach was limited by Honeywell’s less common Series 60/Level 68 hardware, MRDS showed that relational concepts could be implemented as part of a commercial product.
Frisbee from a Multics company picnic (1968–1980) — a glimpse of the community around Honeywell’s computing projects. Source: Biblio
Computerworld coverage of Honeywell’s MRDS launch (September 1976) — part of Honeywell’s high-profile global rollout and among the first commercial ads for a relational DBMS. Source: Google Books
C41_MULTICS_MRDS
C43_ORACLE_CIA
The arrival of MRDS marked a shift: relational computing could now be bought, installed, and supported as part of a vendor’s catalog. It signaled that the interface became naturally woven into commercial environments, where organizations expected stability, documentation, and maintenance to accompany the abstract model.
C43_ORACLE_CIA
Intelligence and Influence — The CIA’s Database Bet
Oracle’s roots trace back to a mix of military contracting, academic research, and Silicon Valley opportunism. Before founding Oracle, Larry Ellison and Bob Miner worked at Ampex, a CIA contractor developing software to manage and retrieve classified information. One of its projects carried the codename “Oracle” — a label Ellison and Miner later kept when they launched Software Development Laboratories (SDL) in 1977.
CIA Headquarters, Langley, Virginia (c. 1979). The agency’s internal project codenamed “Oracle” inspired Larry Ellison’s company name and marked the intersection of espionage and early relational databases. Source: Washington’s Top News
C43_ORACLE_CIA
C44_RDBMS_ADVERTISING
When intelligence agencies explored relational systems, the interface was bound up with secrecy and control. Databases became tools for navigating vast, classified collections, where access rights and retrieval speed carried political weight.
C44_RDBMS_ADVERTISING
Selling the Relational Future — Ads and Market Adoption
As relational systems entered the commercial mainstream, vendors competed on perception as much as on performance. In the late 1970s and early 1980s, ads from IBM, Oracle, and Honeywell translated the relational model into strategic narratives aimed at executives and IT buyers.
Trade journals like Computerworld, Datamation, and Byte filled with images of smart terminals, confident managers, and futuristic dashboards. Oracle leaned into portability and cost-efficiency; IBM emphasized enterprise reliability and integration; Honeywell pitched MRDS as a secure solution backed by Multics’ reputation.
Oracle “Page Your Oracle” television advert, ITV (1986). Campaigns like this reframed relational systems as accessible business tools, blending technical promise with cultural messaging.
These campaigns bridged the gap between theory and enterprise reality. Marketing turned relational databases into a recognizable symbol of efficiency and modernity.
C5
Relational Software Ecosystem
As relational systems spread, they entered the wider software landscape — databases were tied into programming languages, operating systems, and development tools. The interface extended beyond the query prompt to include the links that let SQL work inside applications, creating a network of code and conventions that carried relational systems across platforms.
C51_INGRES_MARKET
INGRES — Berkeley’s Commercial Rush
INGRES stood apart from IBM’s System R and Oracle’s early products. Developed at UC Berkeley by Michael Stonebraker and his team, it served as both a research platform and a teaching tool, making relational databases accessible to students and researchers worldwide. Its open, experimental character contrasted with IBM’s tightly controlled prototypes and Oracle’s aggressive commercial push.
Commercials from magazines
Advertisements for INGRES in computer trade magazines (early 1980s) — positioning the Berkeley spinoff as a challenger to IBM’s slower-moving offerings. Source: Archive.org
Advertisements for INGRES in computer trade magazines (early 1980s) — positioning the Berkeley spinoff as a challenger to IBM’s slower-moving offerings. Source: Archive.org
Advertisements for INGRES in computer trade magazines (early 1980s) — positioning the Berkeley spinoff as a challenger to IBM’s slower-moving offerings. Source: Archive.org
Humorous video advertisement of Ingres. 1980s
In 1980, the team launched Relational Technology Inc., one of the first startups devoted to database software. INGRES’s portability and academic credibility gave it traction in universities and midsize businesses, where it offered a credible alternative to proprietary systems. It showed that relational software could grow not only through corporate channels but also through academic networks that seeded talent, tools, and ideas across the industry.
C51_INGRES_MARKET
C52_C_SQL_CODEPENDENCE
INGRES created a setting where interaction with relational databases became routine. Students, researchers, and early adopters gained practice with SQL in real applications, building habits that shaped how they expected data systems to behave. The project turned relational access into a skill that spread through networks of people as much as through software itself.
C52_C_SQL_CODEPENDENCE
C, SQL, and the Ties That Bind
As relational databases spread into real-world use, they needed to fit into existing software ecosystems. That meant bridging SQL — a high-level, declarative query language — with the low-level power of system programming. In the 1970s and early 1980s, that meant C.
Ken Thompson and Dennis Ritchie at Bell Labs (1970s–1980s). Their creation of C provided the foundation for operating systems and database engines alike. Source: Computer History Museum
Originally developed at Bell Labs for UNIX, C became the language of choice for operating systems and high-performance applications. Its portability, memory control, and ability to interface directly with hardware made it ideal for embedding database engines like Oracle and INGRES. Oracle’s shift from assembly to C allowed the database to scale across platforms, from PDP-11s to minicomputers and eventually PCs.
Developers also needed ways to issue SQL queries from within C programs, leading to embedded SQL, APIs, and eventually standards like ODBC. This coupling between SQL and C defined a generation of software design, intertwining business logic with database access at the code level.
C52_C_SQL_CODEPENDENCE
Cluster C6
Relational systems gained depth when SQL was coupled with C, the programming language that underpinned Unix and much of modern software. Embedding queries inside C programs meant developers could write applications that spoke to databases directly, without treating them as separate utilities. This integration fixed relational databases into the daily practice of coding, closing the ecosystem where interface, logic, and system became continuous.
C6
Foundations of Relational Interaction
The encounter with relational systems was pared down to essentials. Data appeared as tables linked by keys, and the means of access was a terminal screen with a blinking cursor. No graphics, no menus — just structure on one side and typed commands on the other. These early conditions established the grammar and the habits of use that would shape how people interacted with databases for decades to come.
C62_SQL_TERMINALS
Screens and Queries — The Early Interface
The relational model didn’t begin with a graphical interface — it began with typed lines on glass screens. Before mice, menus, or dashboards, early relational database users interacted through terminals like the IBM 3270 or DEC VT52, issuing SQL commands in plain text. The user experience was stark: no buttons, no prompts — just blinking cursors and strict syntax.
An Informatics General programmer at the company’s New York office, reviewing Pascal code for the TAPS product on an IBM 3270 terminal (1983). Photograph by Jonathan Schilling. Source
Technical specifications for an early floppy-disk system used with DEC PDP-11 machines, detailing storage capacity (256 KB per diskette), transfer speeds, and physical dimensions. Such austere interfaces — blinking cursors, command lines, and hardware tied to precise limits — framed the early era of relational database use. Source
This minimalist interface reflected the declarative power of SQL itself. Users didn’t instruct the machine how to find data, only what to find. With commands like SELECT, FROM, and WHERE, users could write expressive queries — but only if they understood the structure of the database. In this early phase, accessibility was limited not by technology, but by knowledge.
Still, the separation of logic from layout opened the door to new interfaces. By the 1980s, relational systems would be paired with form builders, report generators, and eventually, GUI-based database tools. But before all that came the terminal — an austere, textual gateway to structured information.
C62_SQL_TERMINALS
Supercluster D
What these terminals introduced was a new rhythm of interaction: a statement issued, a set returned, the process repeated. This cycle taught users to think of databases as conversational partners bound by rules of language and structure. Even in its barest form, the exchange fixed a template for digital work that continues to shape how people expect to query and receive information.
The Object-Oriented Model — Languages, Databases, and Interfaces
Relational systems gave users a language to ask questions of their data. Object orientation offered something different: a way to interact with computers through entities that looked and behaved like parts of reality.
Instead of working with procedures and tables, people encountered environments built from objects with their own identity and rules. This made interaction less about issuing instructions and more about arranging and guiding parts of a system. From experimental graphics to industrial data systems, the object model reshaped how interfaces looked, felt, and functioned.
D1
Modeling the World: The Rise of Object Orientation
Object orientation began as a strategy for simulation, and its new logic turned abstract modeling into the basis for interaction. By treating parts of a system as active components, object orientation laid the foundation for environments where users would work not through code alone, but through objects that could be reused, extended, and made to respond.
D12_SKETCHPAD_OBJECTS
Sketchpad — The Birth of Interactive Objects
In 1963, Ivan Sutherland’s Sketchpad redefined how humans could work with machines. Built for the TX-2 mainframe at MIT’s Lincoln Lab, it let users draw directly on a screen with a light pen and then duplicate, constrain, or link elements.
Each element behaved like a reusable template, carrying constraints and relationships that could be inherited across instances. Without using the term, Sutherland had created a graphical environment where entities had identity, structure, and hierarchy.
Early research in interface design and cognition. Journals such as the International Journal of Man-Machine Studies built on concepts pioneered by Sketchpad, showing how its ideas influenced both technical design and the emerging study of human–computer interaction. Archive.org
Sketchpad became a foundation for computer-aided design, graphical user interfaces, and later object-oriented languages. It demonstrated that digital systems could respond in real time to visual input, shifting programming toward environments built from objects that could be manipulated directly.
Video demonstration of Sketchpad (1963). Ivan Sutherland shows the system running on the TX-2 computer at MIT’s Lincoln Lab, where users could draw with a light pen and manipulate objects directly on screen.
D12_SKETCHPAD_OBJECTS
D13_SMALLTALK_JAVA
One-off demonstrations could prove the concept, but they had to evolve into environments people could live inside. The step from experimental graphics to a full programming world was where object orientation gained everyday presence.
D13_SMALLTALK_JAVA
Smalltalk to Java — Language Evolution
At Xerox PARC in the early 1970s, Alan Kay and his team drew on Simula, Sketchpad, and LISP to design Smalltalk — a system where everything was an object, from numbers to windows. It introduced dynamic class creation, inheritance, and a live graphical interface, offering an integrated environment rather than a standalone language.
Alan Kay at PARC. His background in music shaped his vision of software as modular, interactive, and improvisational — ideas that guided the creation of Smalltalk in the 1970s. Source: CyborgAnthropology
Cover of Smalltalk-80: The Language (1989) by Adele Goldberg. As part of the Xerox PARC team, she co-developed Smalltalk and advanced key object-oriented concepts that later influenced mainstream programming. Source: Amazon
While commercially limited, Smalltalk’s ideas shaped the next generation of programming. In the 1980s, C++ extended the C language with classes, bringing object orientation into mainstream engineering. By the 1990s, Java simplified object-based design for the web era, and Microsoft’s C# followed with a hybrid model for enterprise software.
D13_SMALLTALK_JAVA
D14_OBJECTS_RUNTIME
Once interaction could be built entirely from objects, the next question was how they behaved in motion. Computer simulations became laboratories where autonomous entities showed what runtime systems could do.
D14_OBJECTS_RUNTIME
Objects in Motion — Simulation and Runtime
Object orientation reshaped runtime environments by modeling programs as systems of interacting entities. Instead of treating code as a single flow of instructions, it allowed multiple objects to act in parallel, each maintaining its own state and responding to events.
This approach, first explored in Simula’s simulations and then applied to visual interfaces, soon shaped interactive software more broadly. Early computer games became laboratories for object-oriented thinking, where complex behavior emerged from collections of autonomous agents rather than centralized scripts.
SimCity (1989). Buildings and services function as autonomous objects, with the city emerging from their interaction and responses to changing conditions. Source
Lemmings (1991). Each lemming follows its own rules. Gameplay comes from coordinating a swarm of reactive objects through a shifting environment. Source
Little Computer People (1985). A simulated household built from objects. Behavior arises not from direct scripts but from the state and affordances of items in the environment. Source
D14_OBJECTS_RUNTIME
Cluster D2
Play and research met practical demand. Technical fields needed the same principles to manage drawings, media, and maps at scale. Here, object-oriented data systems carried the paradigm into applied domains.
D2
Object-Oriented Data Systems — Promise and Limits
As interfaces grew more visual and interactive, attention turned to the structures behind them. Relational tables were efficient, but awkward for hierarchies, media, and evolving versions. Object-oriented databases offered another path: data shaped as objects with identity and behavior.
The idea promised smoother links between storage and interaction. In practice, it produced ambitious experiments, niche successes, and concepts that would echo later in hybrid and NoSQL systems.
D22_OODBMS_APPLICATIONS
CAD, Multimedia, and the Object-Oriented Edge
Object-oriented databases found their strongest applications in domains that required complex representations. Computer-aided design (CAD) relied on nested hierarchies of parts, layered graphics, and evolving versions — all difficult to capture in relational tables.
Multimedia systems demanded ways to unify images, video, and sound under shared structures. Geographic information systems (GIS) layered spatial and temporal data into interlinked objects.
M&S Computing (later Intergraph) demonstrating CAD tools (1978). Early CAD required models with nested parts and evolving versions — pressures that encouraged the adoption of object-oriented databases for representing complex structures. Source
Projects such as STORM, developed at the University of Wisconsin, and Jasmine, a Japanese research initiative, demonstrated media-aware queries that could traverse formats and timelines. Teradata GIS and related efforts applied object-oriented logic to mapping and infrastructure, letting analysts represent geography as linked entities rather than disconnected records.
Interfaces Now — How We Talk to Machines
From the relational table to the simulated city, the interface became the ground where human intention met machine logic. Relational systems taught people to converse with data through structured language, while object-oriented design let them manipulate environments built from entities with their own rules.
***
Together these trajectories defined the modern expectation: that computers should not expose storage or mechanics, but provide surfaces where queries, objects, and behaviors could be managed directly. By the end of the 20th century, the interface had become less a tool than an environment — a shared space of language, graphics, and simulation that shaped how information would be lived with and acted upon.